Fig. A.8
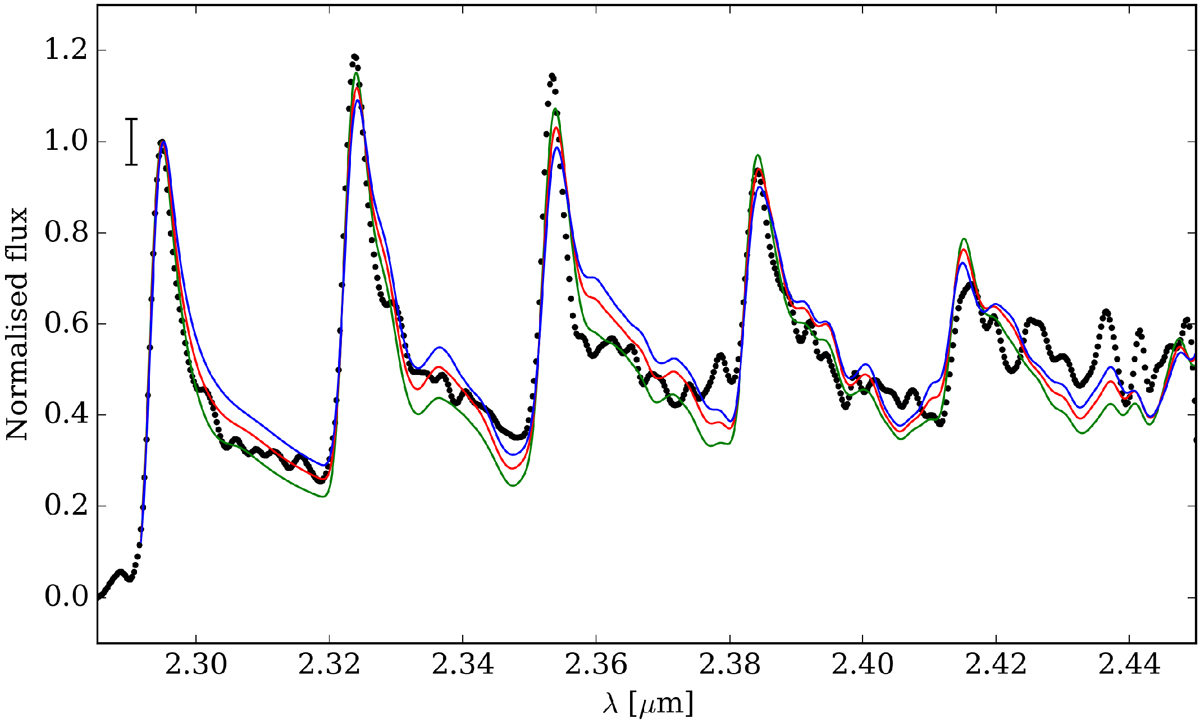
Same as Fig. A.4, but for models with fixed values of T = 2400 K, NCO = 4 × 1021 cm−2, and vrot sini = 130 km s−1. Coloured solid lines represent models with different values of the intrinsic line width: Δv = 10 km s−1 (solid green line), Δv = 15 km s−1 (solid red line), and Δv = 20 km s−1 (solid blue line). The data are smoothed at a resolution of R = 1000. When the data are smoothed the first bandhead becomes smaller because the line peak has only a few points, which causes the second and third bandhead to exceed than the unsmoothed spectra when we normalise.
Current usage metrics show cumulative count of Article Views (full-text article views including HTML views, PDF and ePub downloads, according to the available data) and Abstracts Views on Vision4Press platform.
Data correspond to usage on the plateform after 2015. The current usage metrics is available 48-96 hours after online publication and is updated daily on week days.
Initial download of the metrics may take a while.