Fig. A.7
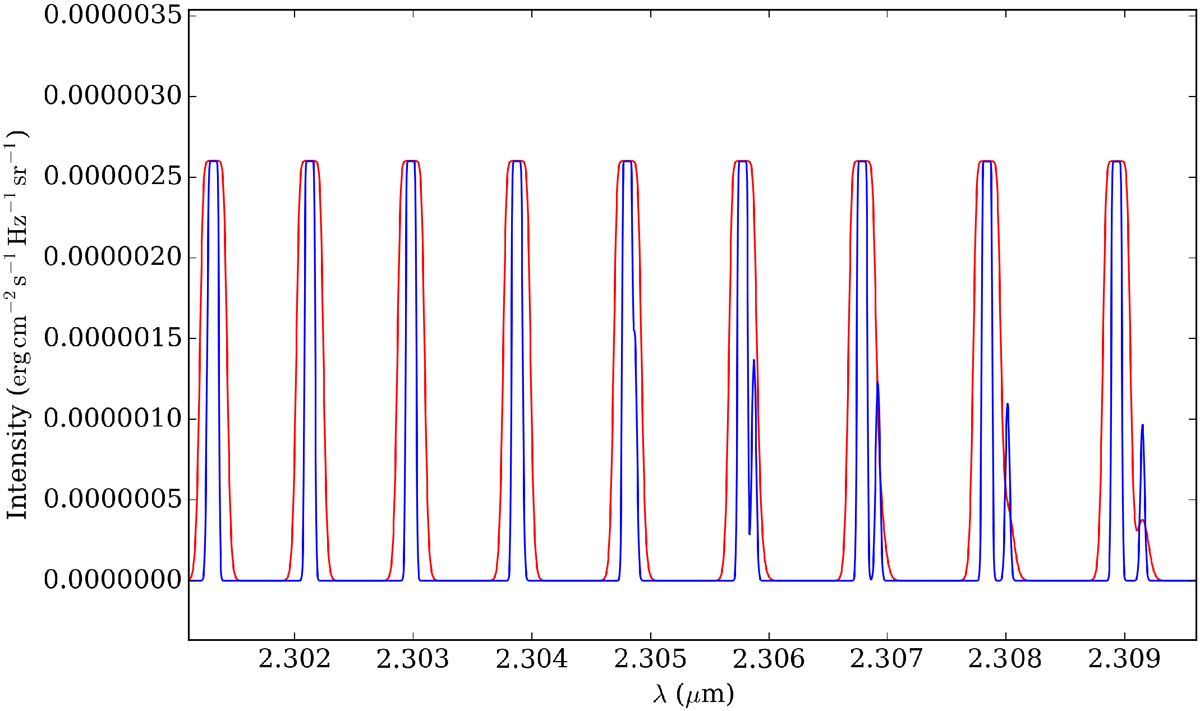
Individual CO J components profiles contributing to the line intensity of the first CO bandhead (υ = 2–0) for wavelengths ranging from 2.302 to 2.309 μm at a spectral resolution R = 100 000. Models computed for intrinsic line widths of Δv = 5 km s−1 (blue solid line), and Δv = 15 km s−1 (red solid line), and fixed values of T = 2400 K, NCO = 4 × 1021 cm−2, and vrot sini = 130 km s−1 are shown. To facilitate comparison, the model with Δv = 5 km s−1 has been scaled-up to match the peak intensity of the J components with higher Δv value.
Current usage metrics show cumulative count of Article Views (full-text article views including HTML views, PDF and ePub downloads, according to the available data) and Abstracts Views on Vision4Press platform.
Data correspond to usage on the plateform after 2015. The current usage metrics is available 48-96 hours after online publication and is updated daily on week days.
Initial download of the metrics may take a while.