Fig. A.4
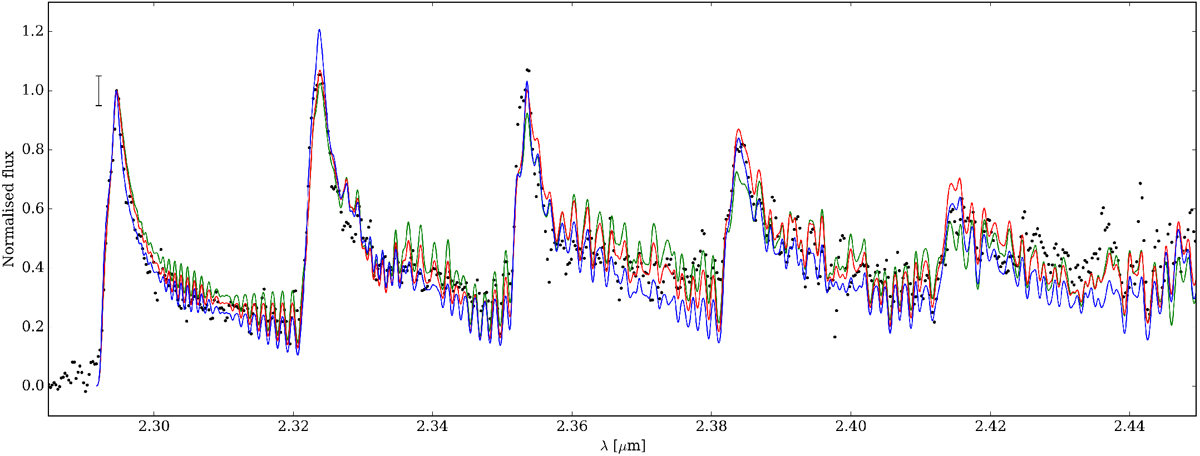
Continuum-subtracted spectrum of 51 Oph normalised to the peak intensity of the first bandhead (black dots). Predictions of theoretical CO ring models as described in the main text are overplotted (solid coloured lines). The vertical black line in the upper left corner of the first bandhead represent twice the rms value measured in the observed continuum region adjacent to the first bandhead. The models have been computed for combinations of T and NCO values of T = 1800 K, NCO = 1 × 1022 cm−2 (green), T = 2400 K, NCO = 4 × 1021 cm−2 (red), and T = 2900 K, NCO = 8 × 1020 cm−2 (blue) with aconstant value of Δv = 15 km s−1, and vrot sini = 130 km s−1.
Current usage metrics show cumulative count of Article Views (full-text article views including HTML views, PDF and ePub downloads, according to the available data) and Abstracts Views on Vision4Press platform.
Data correspond to usage on the plateform after 2015. The current usage metrics is available 48-96 hours after online publication and is updated daily on week days.
Initial download of the metrics may take a while.