Fig. 12.
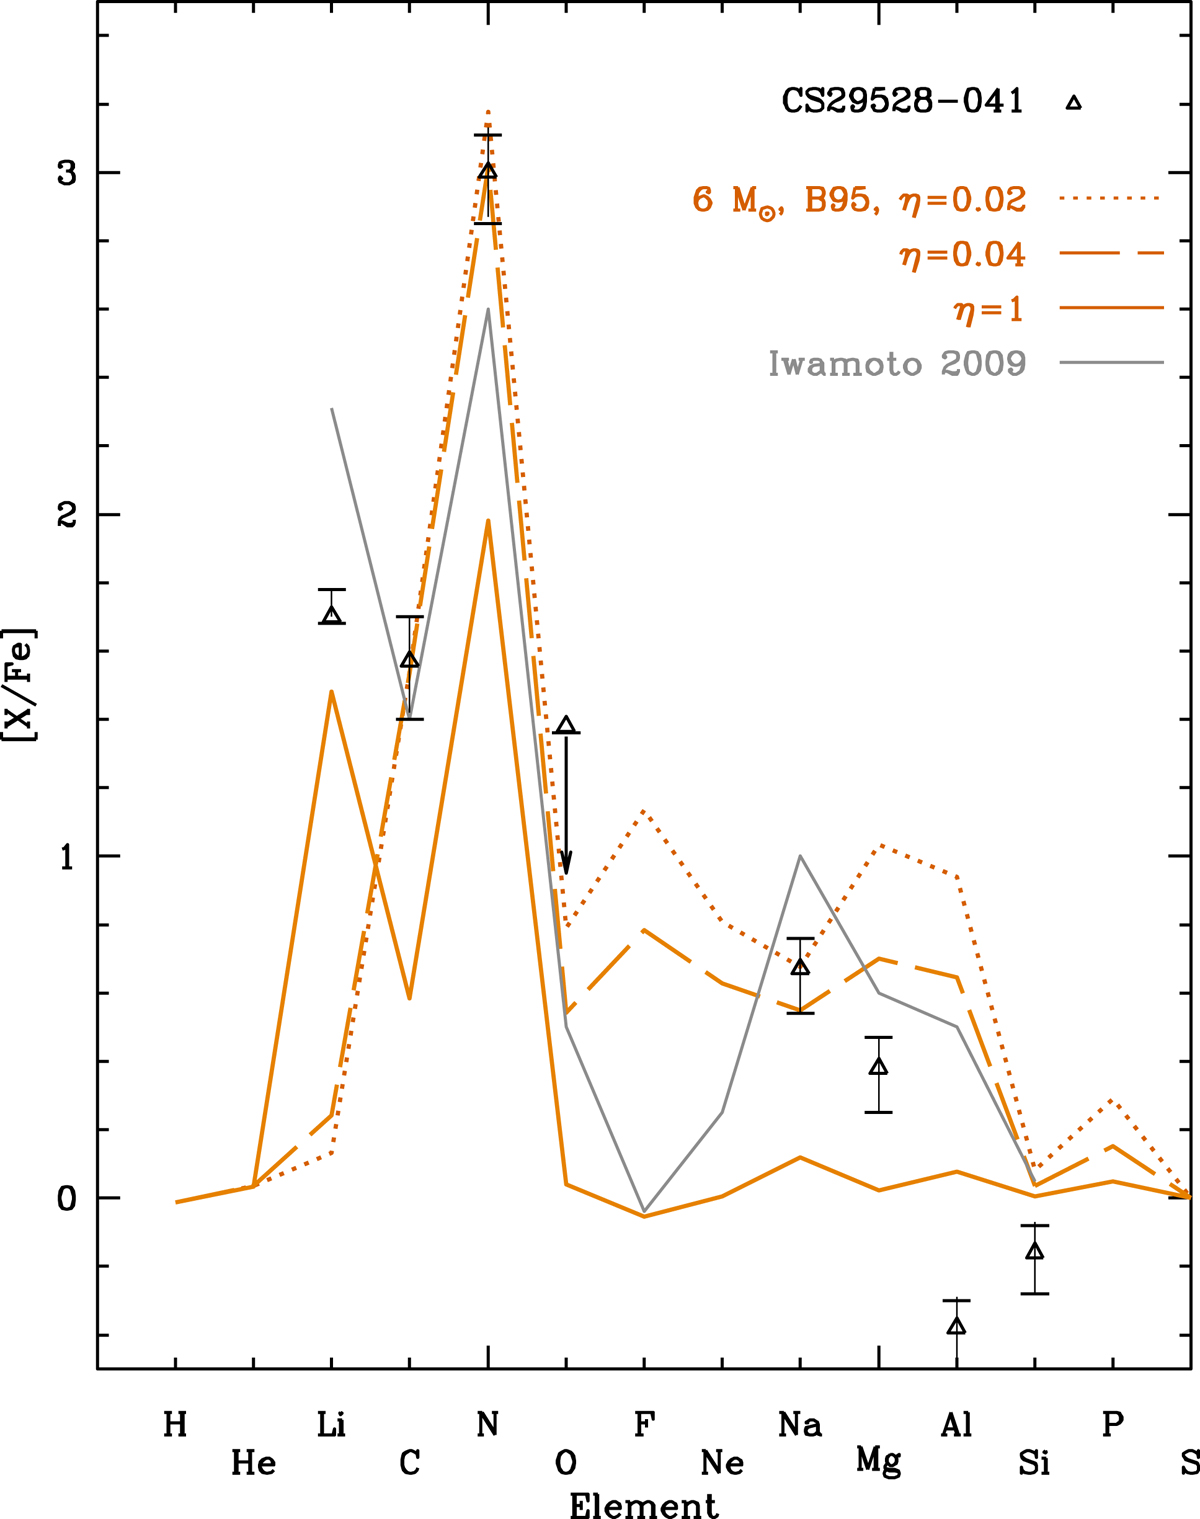
Abundance pattern in terms of the ejecta of the 6 M⊙ models computed with the Blo95 wind prescription, and assuming dilution with a low-mass star envelope (see Fig. 11 and main text for details), with η = 0.02, (dotted line), η = 0.04 (dashed line), and η = 1 (solid line). Abundances from the Z = 2 × 10⁻⁵, 6 M⊙ model by Iwamoto (2009) are shown by the grey solid line. Symbols represent the observed abundances of CS29528-041.
Current usage metrics show cumulative count of Article Views (full-text article views including HTML views, PDF and ePub downloads, according to the available data) and Abstracts Views on Vision4Press platform.
Data correspond to usage on the plateform after 2015. The current usage metrics is available 48-96 hours after online publication and is updated daily on week days.
Initial download of the metrics may take a while.