Fig. 10.
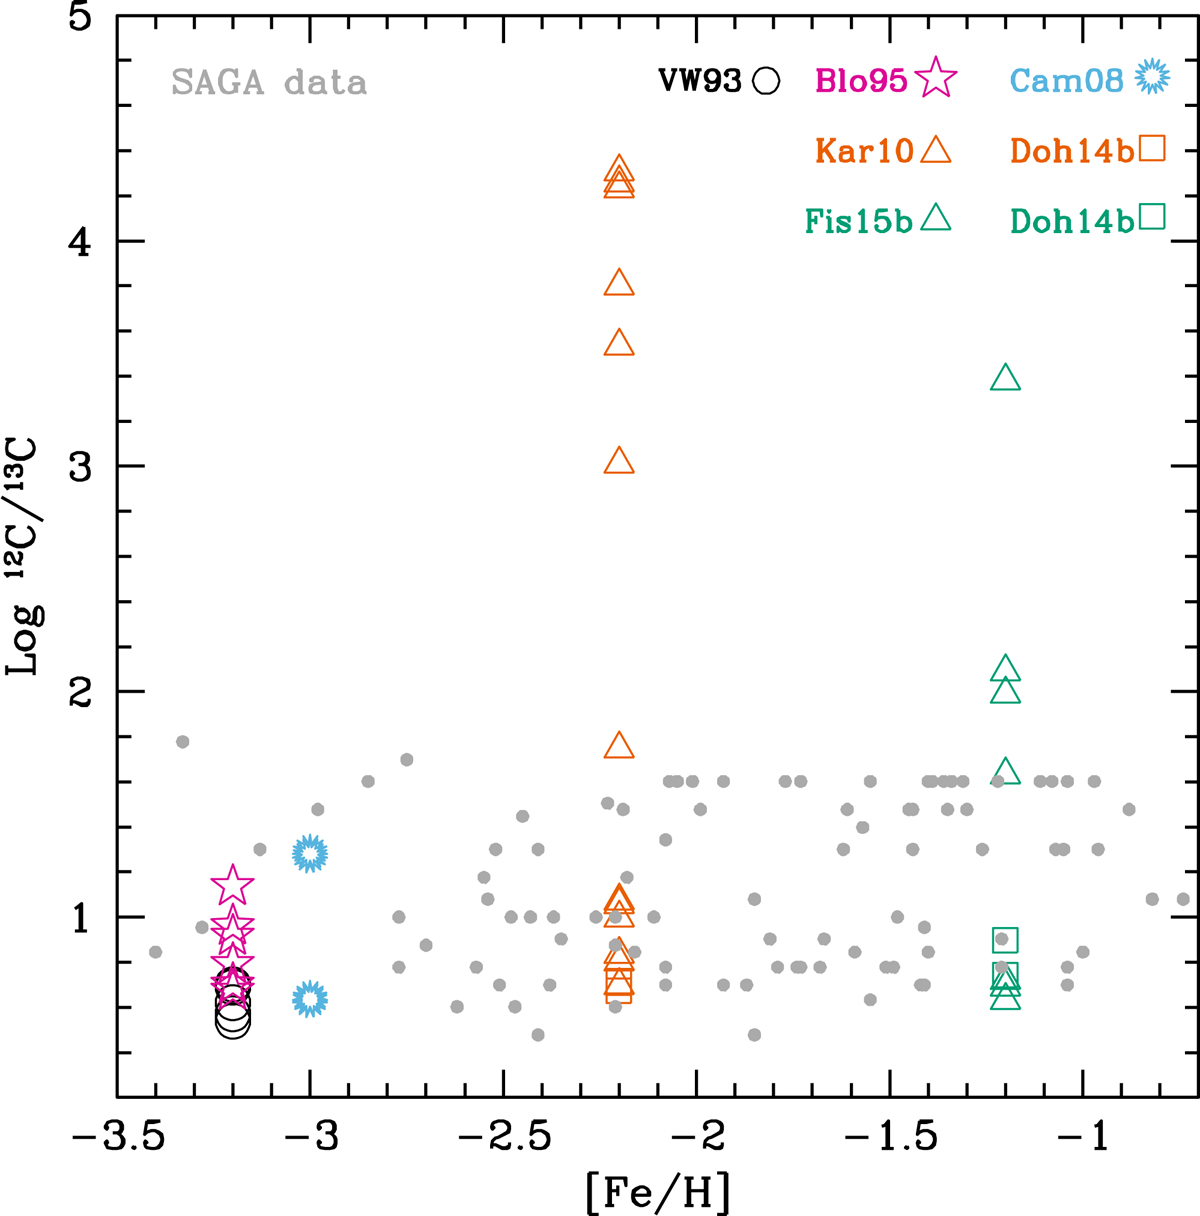
Averaged carbon isotopic ratios vs. metallicity resulting from our model stars using the VW mass-loss prescription (black circles), and Blo95 with η = 0.02 (pink stars); from Campbell & Lattanzio (2008; blue stars); Karakas (2010; orange triangles), Doherty et al. (2014b; orange squares); Fishlock et al. (2014; green triangles), and from Doherty et al. (2014b; green squares). Grey symbols represent the observed ratios obtained from the SAGA database (Suda et al. 2008).
Current usage metrics show cumulative count of Article Views (full-text article views including HTML views, PDF and ePub downloads, according to the available data) and Abstracts Views on Vision4Press platform.
Data correspond to usage on the plateform after 2015. The current usage metrics is available 48-96 hours after online publication and is updated daily on week days.
Initial download of the metrics may take a while.