Fig. 5.
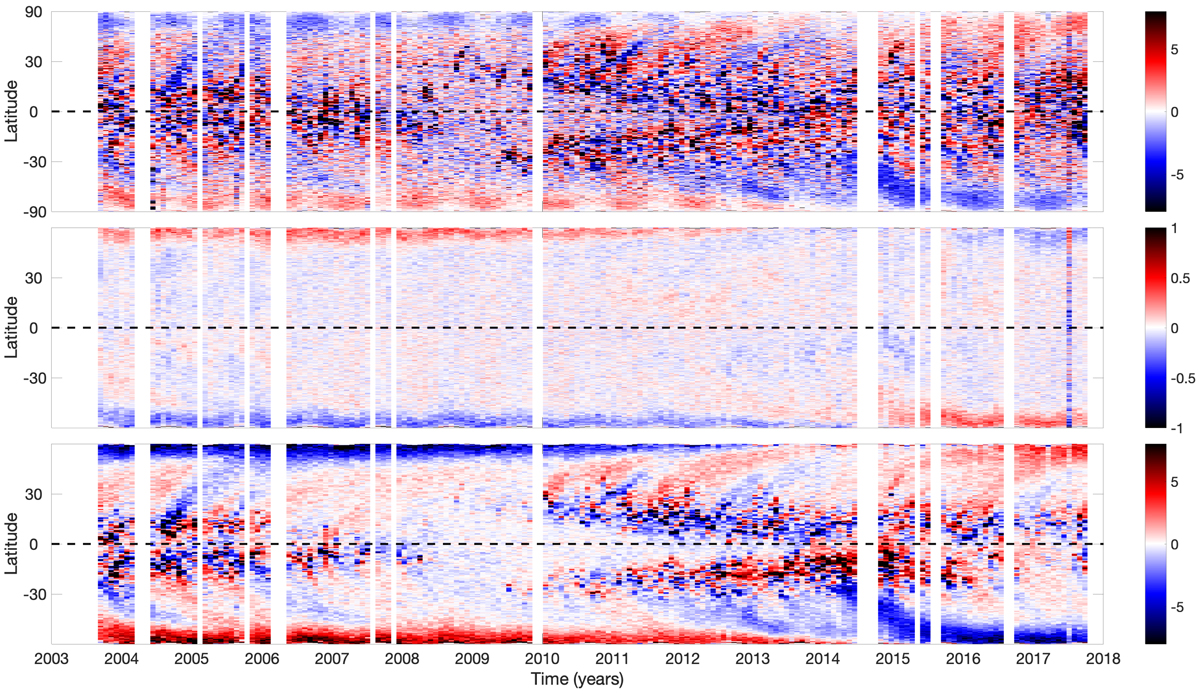
Results for skewness from SOLIS/VSM synoptic maps. Top: skewness calculated for each latitude bin and rotation using all field values, called here the full-field skewness butterfly diagram (positive skewness in red, negative in blue). Middle: same as in top panel, but using only weak-field values to calculate skewness, called here the weak-field skewness butterfly diagram. Bottom: longitudinal means of the photospheric field for each latitude bin and rotation, known as the normal magnetic butterfly diagram.
Current usage metrics show cumulative count of Article Views (full-text article views including HTML views, PDF and ePub downloads, according to the available data) and Abstracts Views on Vision4Press platform.
Data correspond to usage on the plateform after 2015. The current usage metrics is available 48-96 hours after online publication and is updated daily on week days.
Initial download of the metrics may take a while.