Fig. 1.
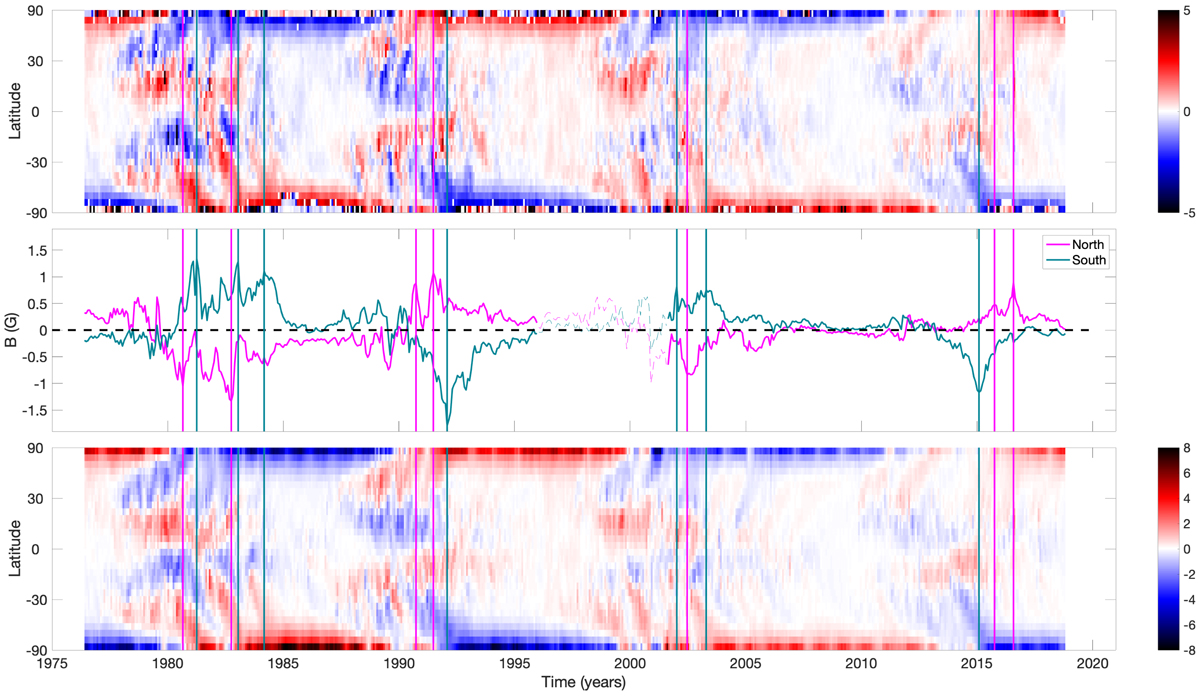
Results for weak-field shifts from WSO synoptic maps. Top: weak-field shifts calculated for each latitude bin and rotation, called here the shift butterfly diagram (positive shifts in red, negative in blue). Middle: hemispheric shift values (north in pink, south in cyan). Bottom: longitudinal means of the photospheric field for each latitude bin and rotation, i.e., the normal magnetic butterfly diagram (positive field in red, negative in blue). Vertical lines denote the shift extrema (north in pink, south in cyan).
Current usage metrics show cumulative count of Article Views (full-text article views including HTML views, PDF and ePub downloads, according to the available data) and Abstracts Views on Vision4Press platform.
Data correspond to usage on the plateform after 2015. The current usage metrics is available 48-96 hours after online publication and is updated daily on week days.
Initial download of the metrics may take a while.