Free Access
Fig. 1.
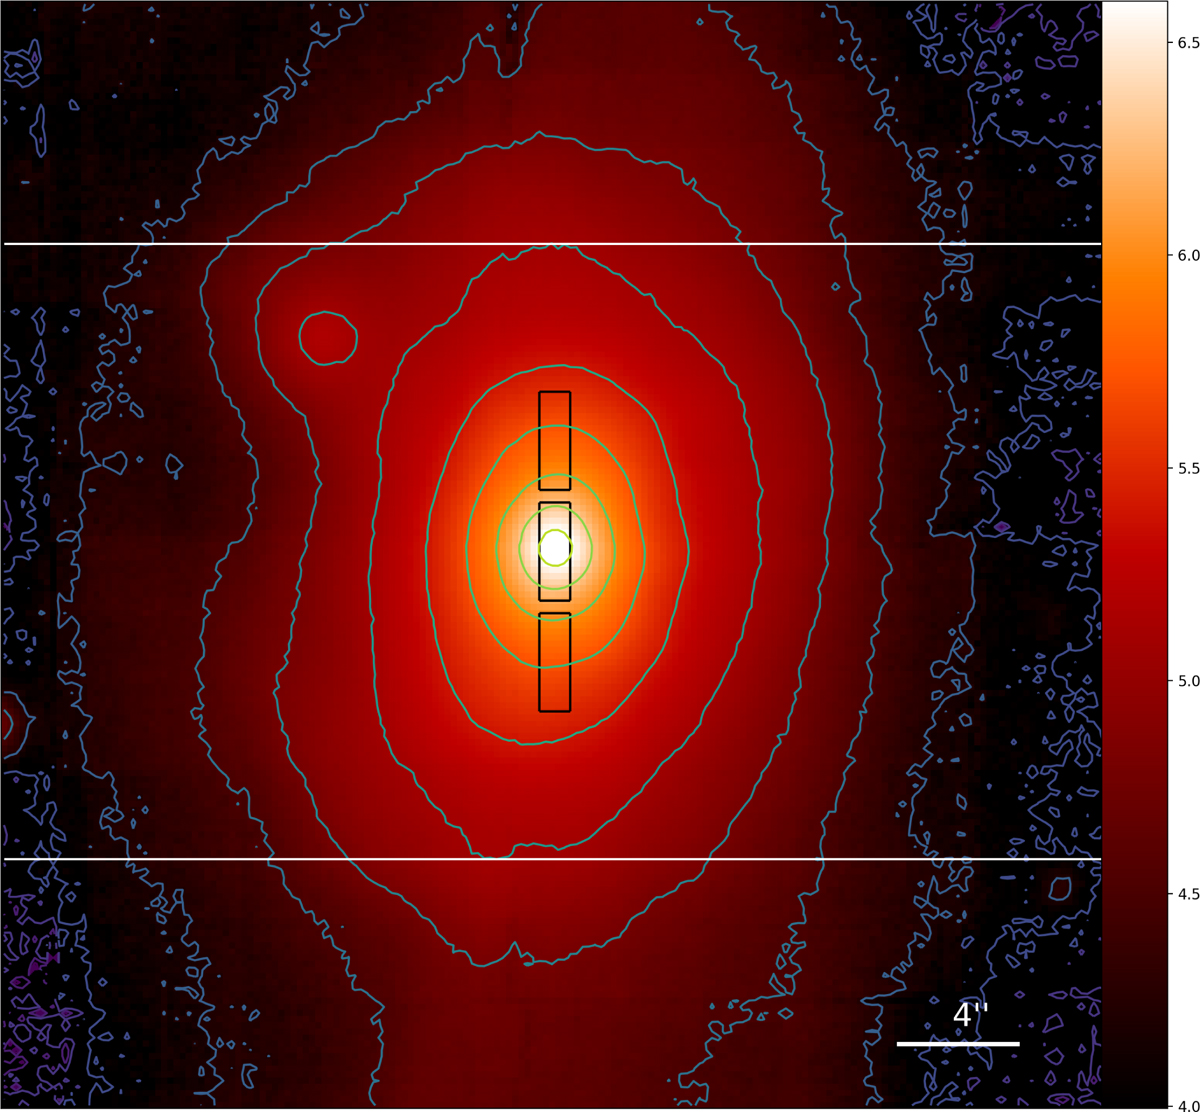
Visible image of Mrk 1018 obtained with the MUSE integral spectrograph (McElroy et al. 2016). North is up and east is left. The intensity scale is logarithmic (arbitrary units). The positions of the ![]() subslits used for the spectrum extraction are indicated. The horizontal lines delineate the MOS strip.
subslits used for the spectrum extraction are indicated. The horizontal lines delineate the MOS strip.
Current usage metrics show cumulative count of Article Views (full-text article views including HTML views, PDF and ePub downloads, according to the available data) and Abstracts Views on Vision4Press platform.
Data correspond to usage on the plateform after 2015. The current usage metrics is available 48-96 hours after online publication and is updated daily on week days.
Initial download of the metrics may take a while.