Free Access
Fig. 9.
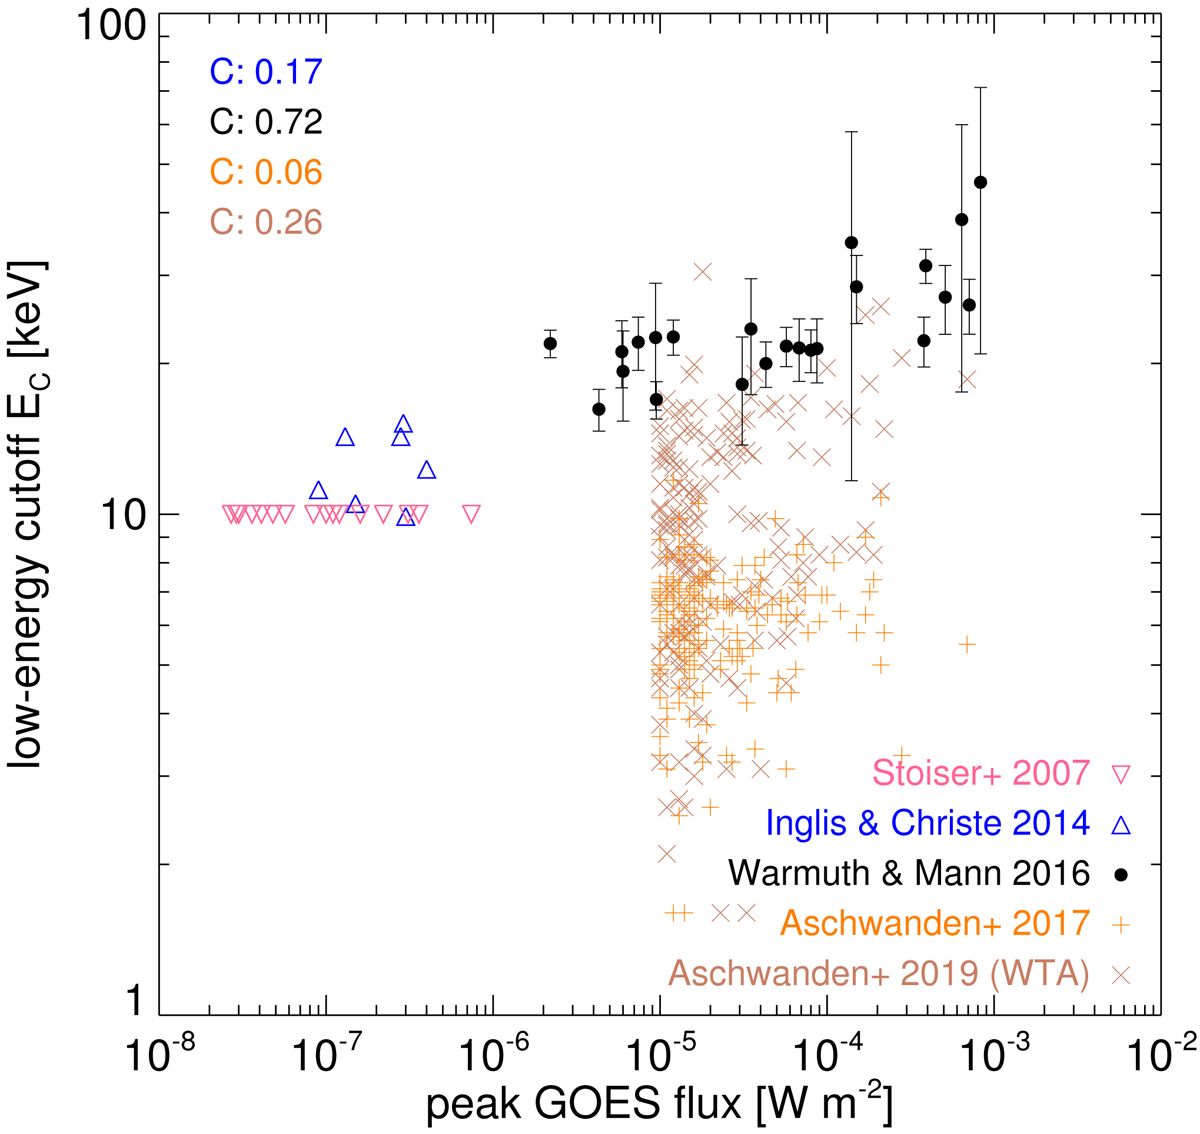
Low-energy cutoffs EC plotted vs. GOES peak flux as derived by with the spectral cross-over method by S+07, IC14, and WM16 (here, the mean and standard deviation of the cutoff is shown for each flare), and with the warm-target approximation by A+17 and A+19.
Current usage metrics show cumulative count of Article Views (full-text article views including HTML views, PDF and ePub downloads, according to the available data) and Abstracts Views on Vision4Press platform.
Data correspond to usage on the plateform after 2015. The current usage metrics is available 48-96 hours after online publication and is updated daily on week days.
Initial download of the metrics may take a while.