Fig. 1.
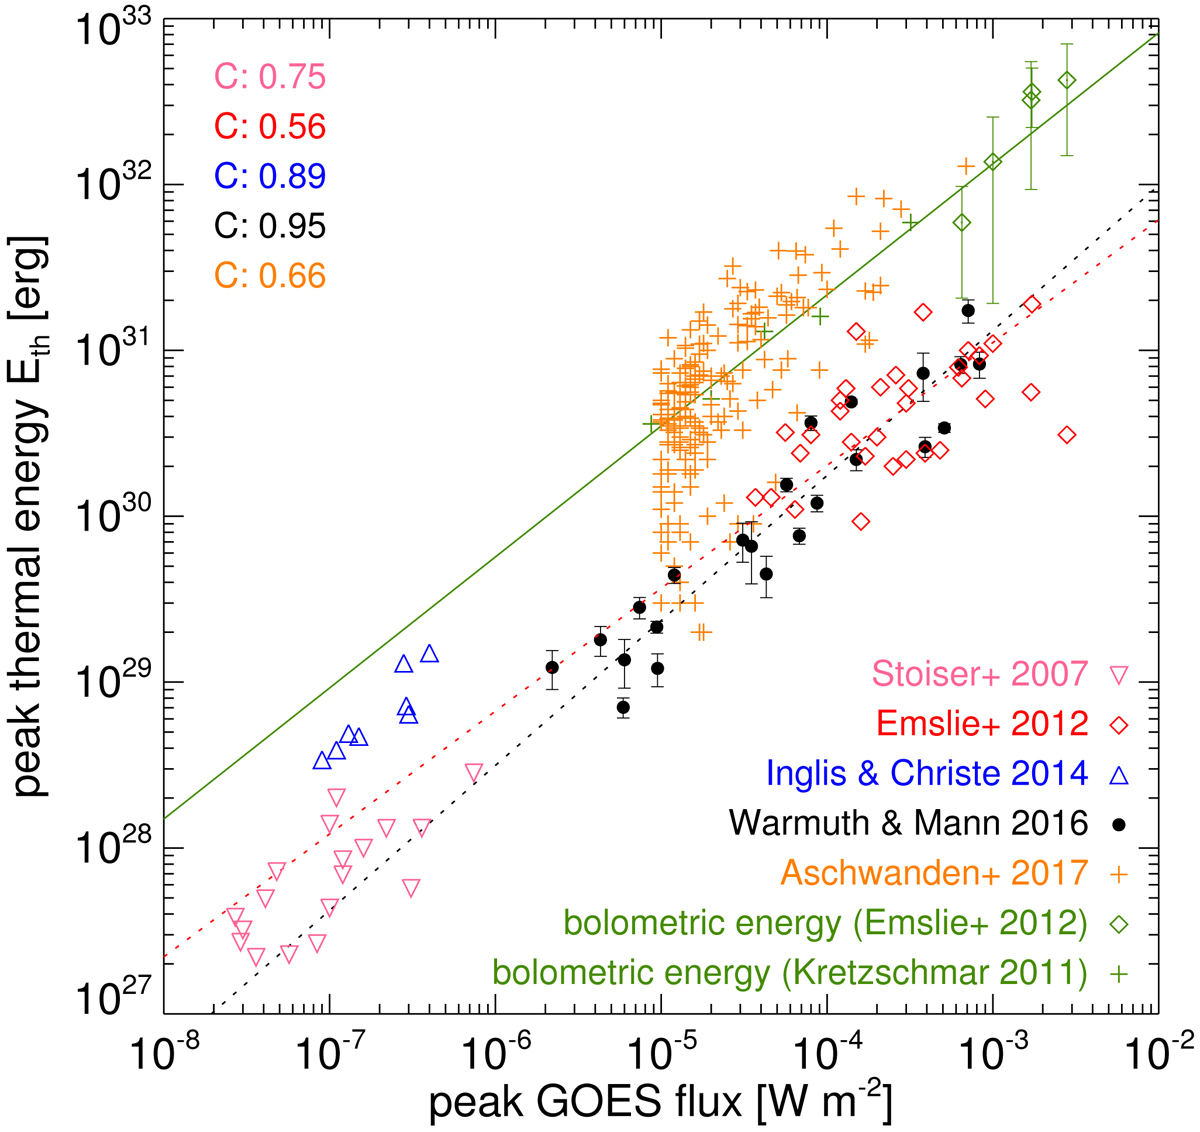
Peak thermal energy Eth vs. peak GOES flux for all five studies. For comparison, the total radiated energies Ebol derived from SORCE/TIM (green diamonds) and SOHO/VIRGO (green crosses; the green line is a power-law fit to these data points) are shown. C indicates the linear correlation coefficient of the logarithms of the value pairs. The dotted lines indicate power-law fits to the values of E+12 and WM16.
Current usage metrics show cumulative count of Article Views (full-text article views including HTML views, PDF and ePub downloads, according to the available data) and Abstracts Views on Vision4Press platform.
Data correspond to usage on the plateform after 2015. The current usage metrics is available 48-96 hours after online publication and is updated daily on week days.
Initial download of the metrics may take a while.