Fig. 2
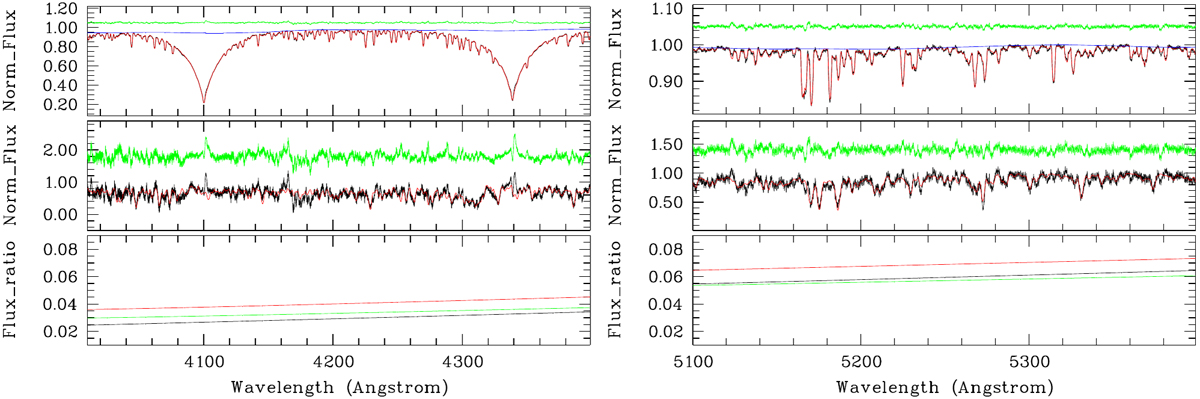
Results of spectrum analysis using method a (cf. Sect. 3.3, Table 2), shown for the Hδ -Hγ region (left) and the region around the Mg I b triplet (right). First row: observed, continuum adjusted composite spectrum (black), best-fitting synthetic spectrum (red), and shifted difference spectrum (green). The inverse of the applied continuum correction is shown in blue. Second row: same for the secondary. Third row:flux ratio of the secondary to primary from photometry (black) from spectrum analysis based on R2 ∕R1 = 0.926 (red) and assuming the adjusted ratio of 0.78 (green).
Current usage metrics show cumulative count of Article Views (full-text article views including HTML views, PDF and ePub downloads, according to the available data) and Abstracts Views on Vision4Press platform.
Data correspond to usage on the plateform after 2015. The current usage metrics is available 48-96 hours after online publication and is updated daily on week days.
Initial download of the metrics may take a while.