Free Access
Fig. A.1
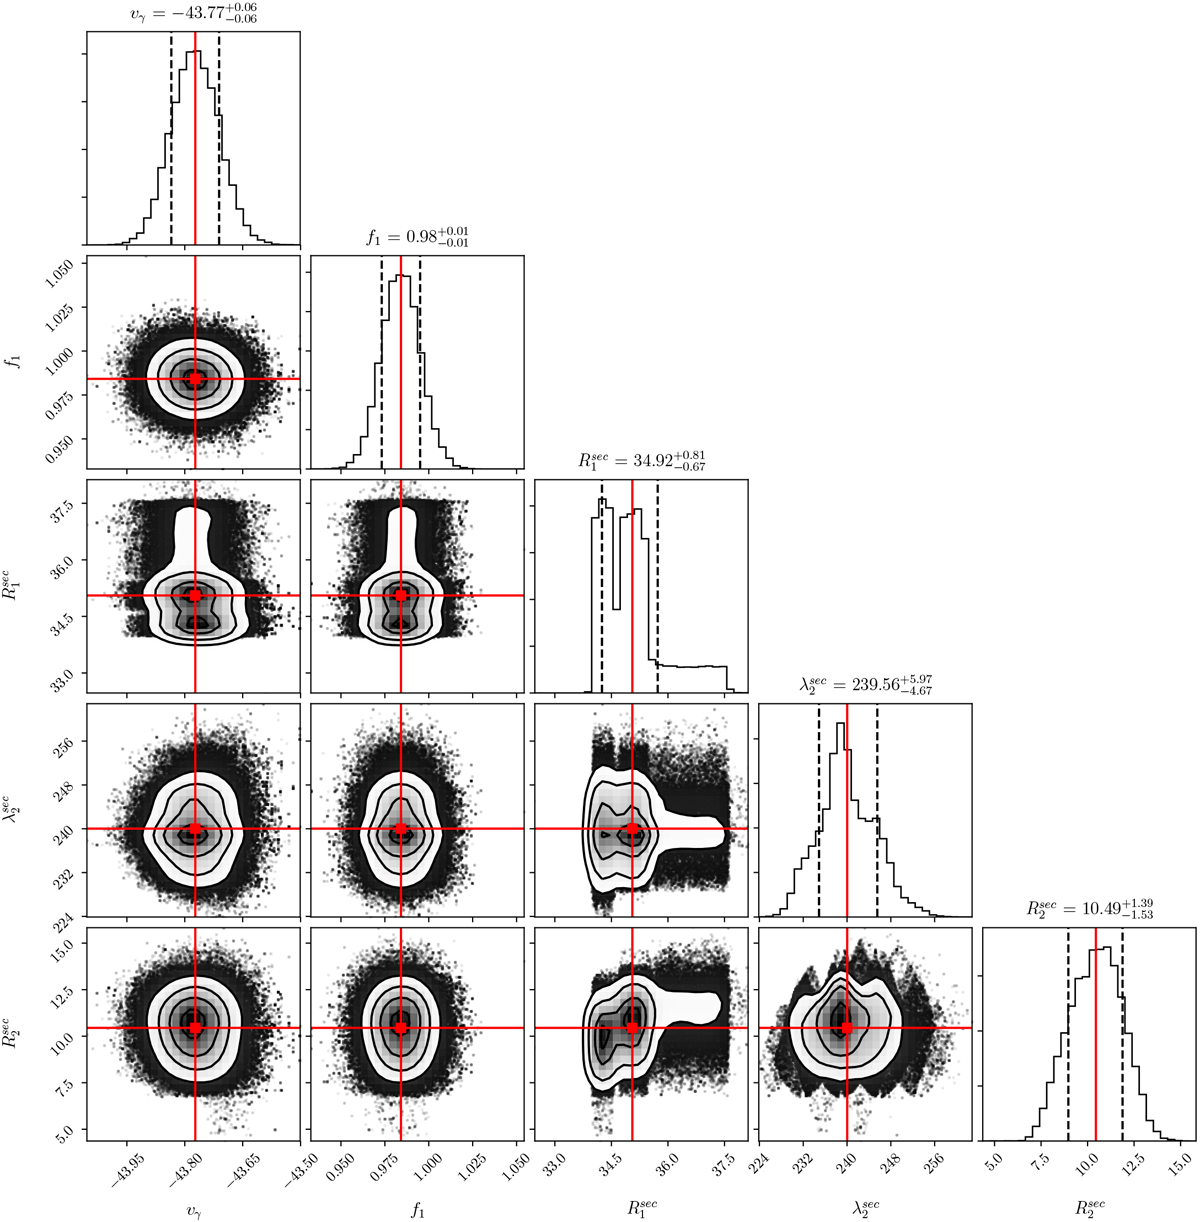
Corner plot for the year 2009, showing the χ2 distributions for systemic velocity, synchronisation factor of the primary, radius of the spot on the secondary facing the primary, and longitude and radius of the opposite spot on the secondary.
Current usage metrics show cumulative count of Article Views (full-text article views including HTML views, PDF and ePub downloads, according to the available data) and Abstracts Views on Vision4Press platform.
Data correspond to usage on the plateform after 2015. The current usage metrics is available 48-96 hours after online publication and is updated daily on week days.
Initial download of the metrics may take a while.