Fig. 15
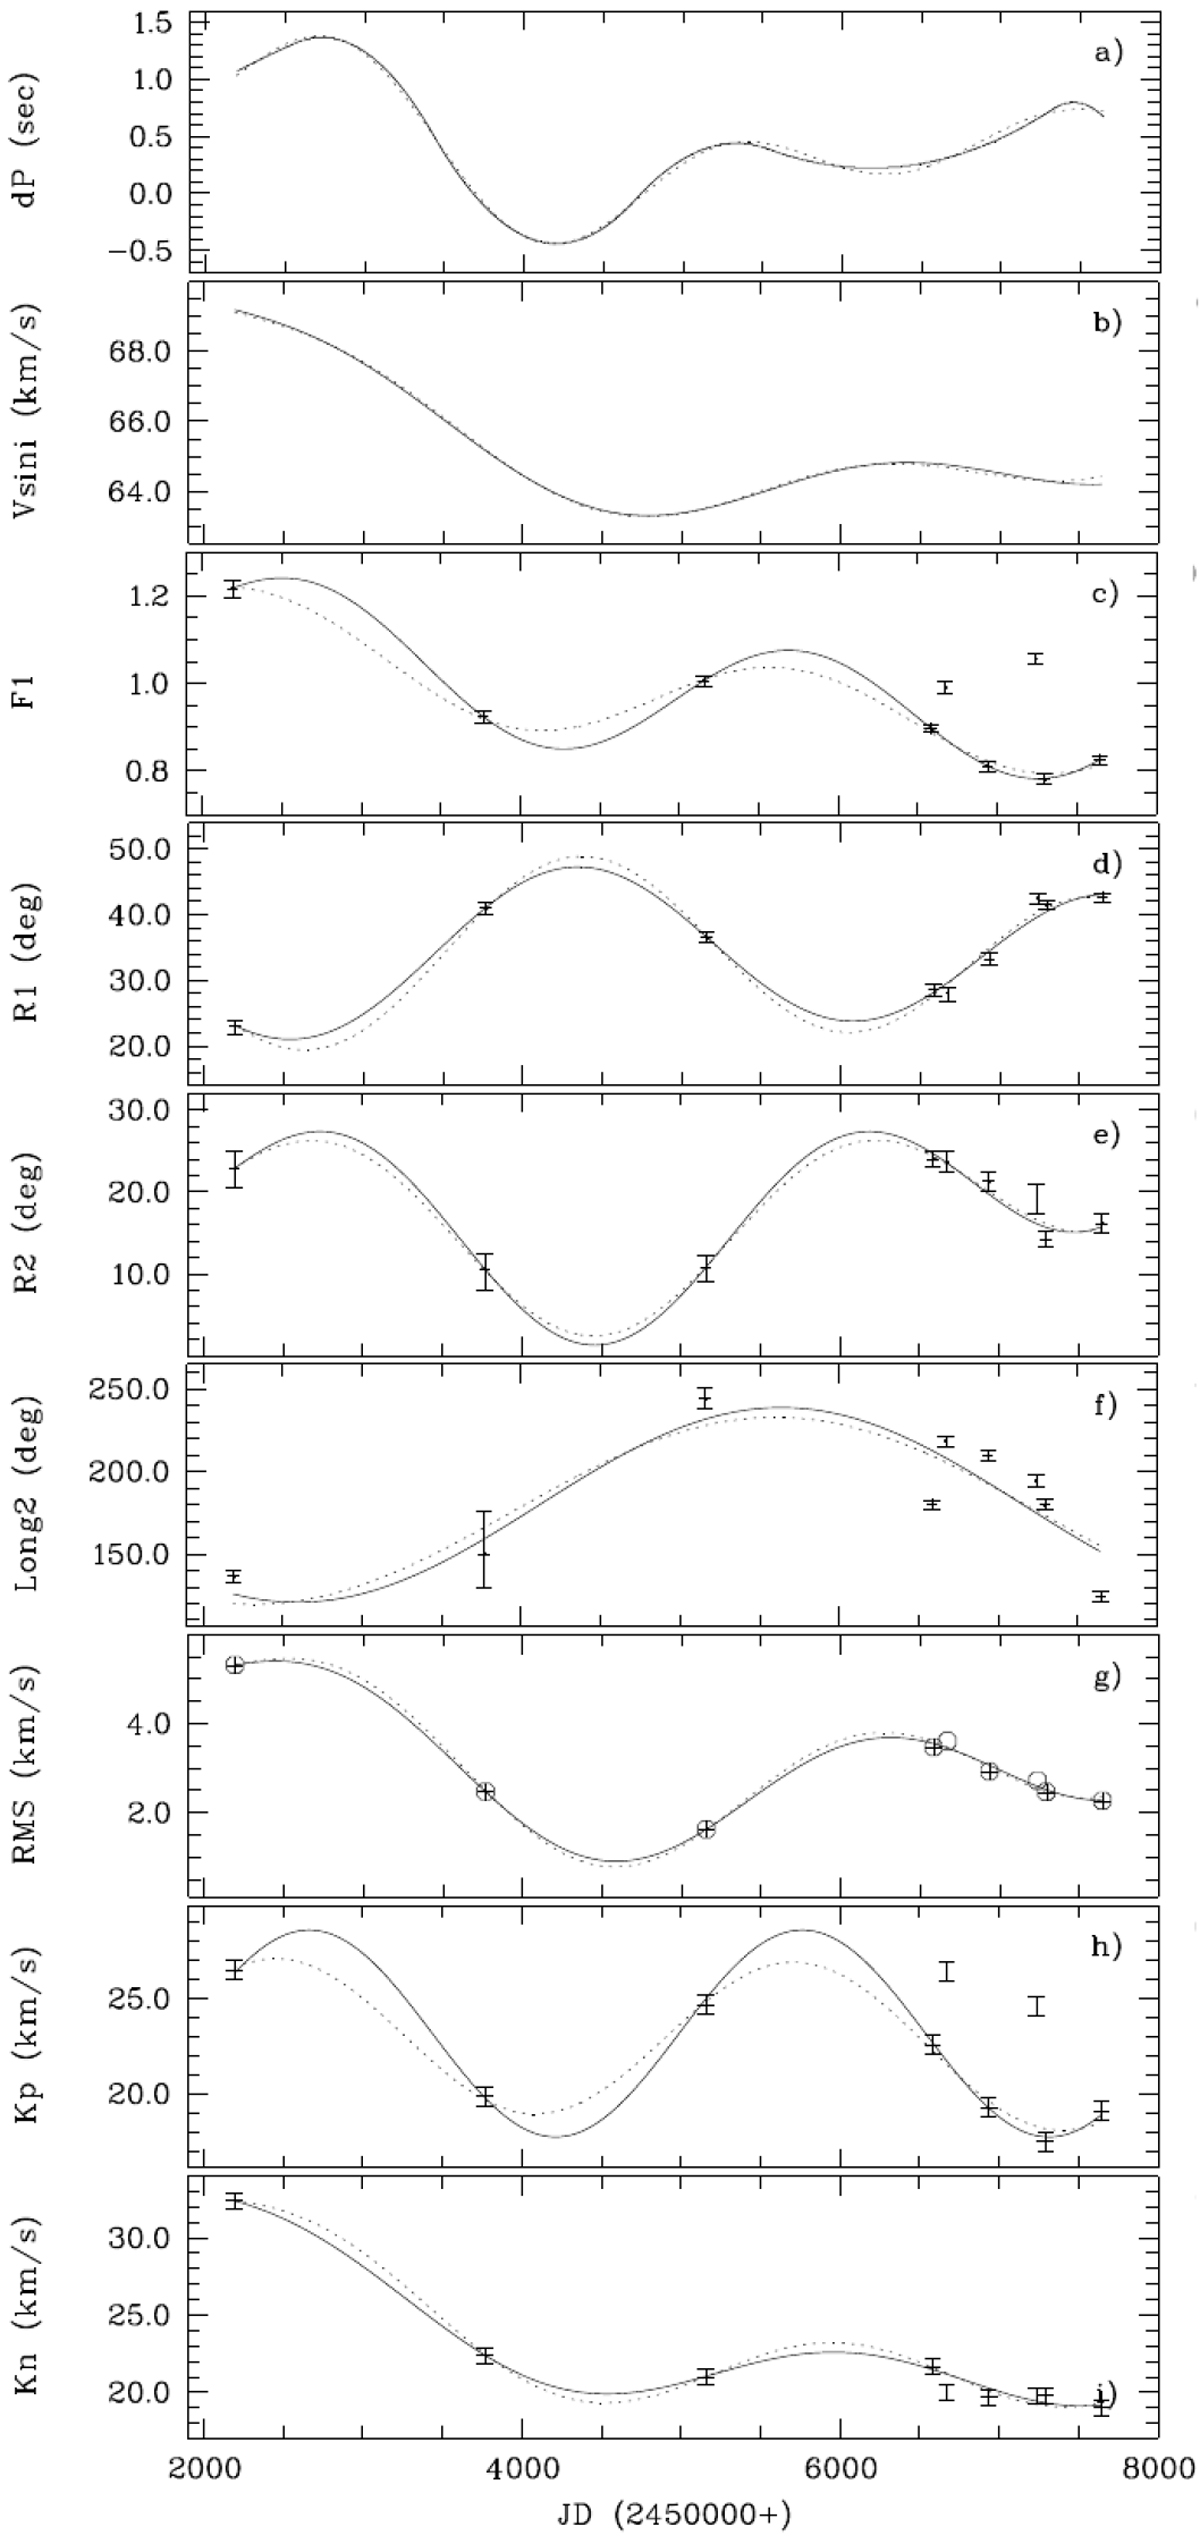
Time variations of different parameters (see text). The solid lines are calculated from the best-fitting periods and long-term trends. The dotted lines show possible sinusoidal variations with a period of 9 yr plus a long-term trend, except for panel f, which shows an 18 yr variation. Values from 2013b and 2015a were considered as outliers.
Current usage metrics show cumulative count of Article Views (full-text article views including HTML views, PDF and ePub downloads, according to the available data) and Abstracts Views on Vision4Press platform.
Data correspond to usage on the plateform after 2015. The current usage metrics is available 48-96 hours after online publication and is updated daily on week days.
Initial download of the metrics may take a while.