Fig. 11
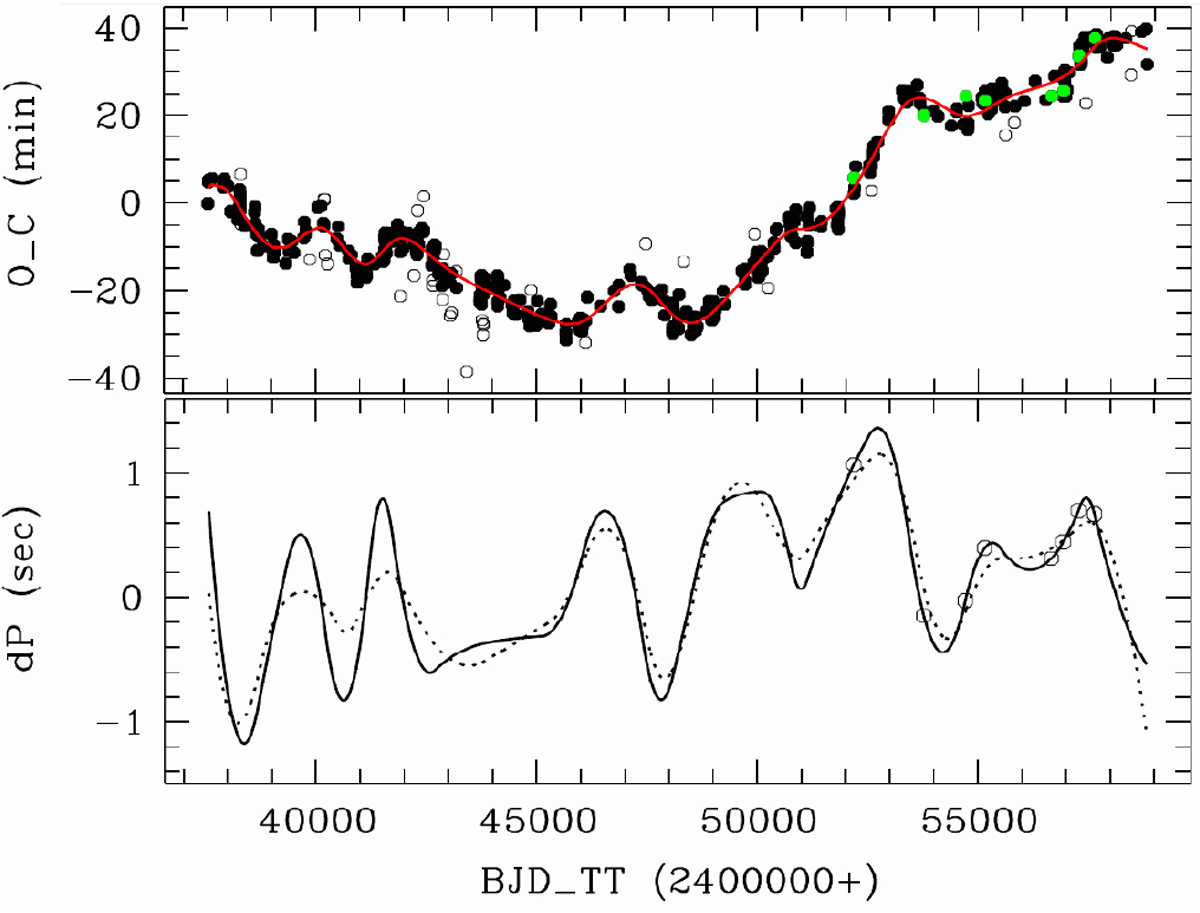
O–C values and derived period changes. Top: O–C values (filled black circles) fitted by splines (red line). Values considered as outliers are shown by open circles and those derived from our spectra in green. Bottom: period changes calculated from the local slope of the spline fit (see text). Open circlesindicate the seasons of our spectroscopic observations.
Current usage metrics show cumulative count of Article Views (full-text article views including HTML views, PDF and ePub downloads, according to the available data) and Abstracts Views on Vision4Press platform.
Data correspond to usage on the plateform after 2015. The current usage metrics is available 48-96 hours after online publication and is updated daily on week days.
Initial download of the metrics may take a while.