Fig. 1
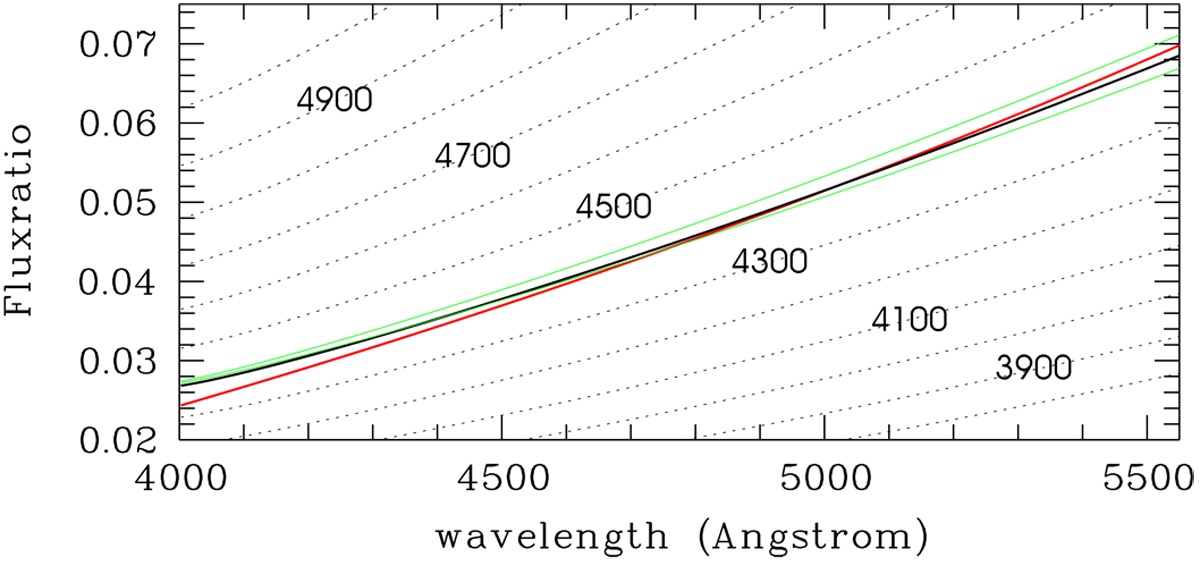
Continuum flux ratios between the components vs. wavelength. The dotted lines are calculated from synthetic continuum spectra with Teff1 of 8700 K and Teff2 of 3800–5000 K. The best agreement with the flux ratio from photometry (red line) is obtained for Teff2 = 4400 K (black solid line). The upper green line represents Teff1 = 9000 K, Teff2 = 4500 K, the lower green line for Teff1 = 8400 K, Teff2 = 4300 K.
Current usage metrics show cumulative count of Article Views (full-text article views including HTML views, PDF and ePub downloads, according to the available data) and Abstracts Views on Vision4Press platform.
Data correspond to usage on the plateform after 2015. The current usage metrics is available 48-96 hours after online publication and is updated daily on week days.
Initial download of the metrics may take a while.