Free Access
Fig. 9.
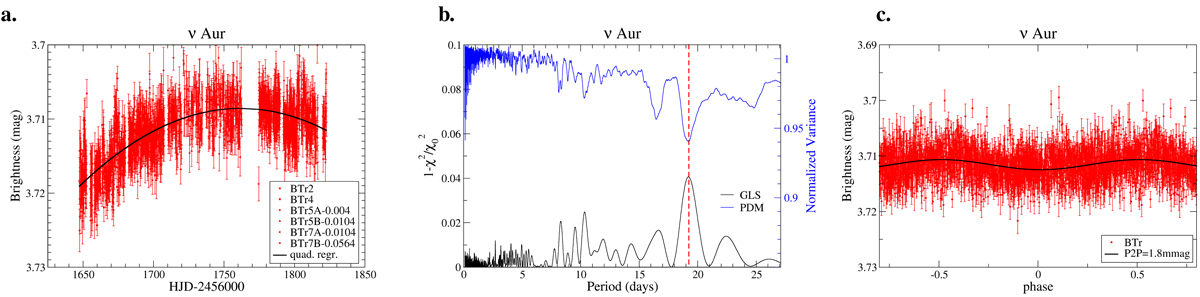
Photometry of ν Aur from BRITE. Panel a: full data sample, only BTr data were acquired. The line is a quadratic polynomial fit that was then removed from the data for the periodograms. Panel b: periodograms. Panel c: phased light curve with the 19.16 d period. Otherwise as in Fig. 3.
Current usage metrics show cumulative count of Article Views (full-text article views including HTML views, PDF and ePub downloads, according to the available data) and Abstracts Views on Vision4Press platform.
Data correspond to usage on the plateform after 2015. The current usage metrics is available 48-96 hours after online publication and is updated daily on week days.
Initial download of the metrics may take a while.