Fig. 7.
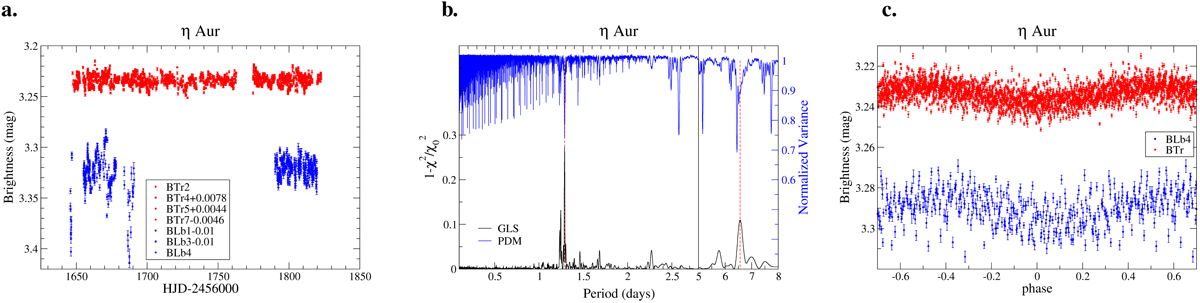
Photometry of η Aur from BRITE. Panel a: full data sample. Panel b: periodograms. The period axis is split into two parts for the ranges 0–2.8 d and- 5–8 d. The main peak is at a period at 1.28 d, while other significant peaks are seen at 1.23 d and 6.6 d. Panel c: phased light curve with the 1.28 d period. Otherwise as in Fig. 3.
Current usage metrics show cumulative count of Article Views (full-text article views including HTML views, PDF and ePub downloads, according to the available data) and Abstracts Views on Vision4Press platform.
Data correspond to usage on the plateform after 2015. The current usage metrics is available 48-96 hours after online publication and is updated daily on week days.
Initial download of the metrics may take a while.