Fig. A.1.
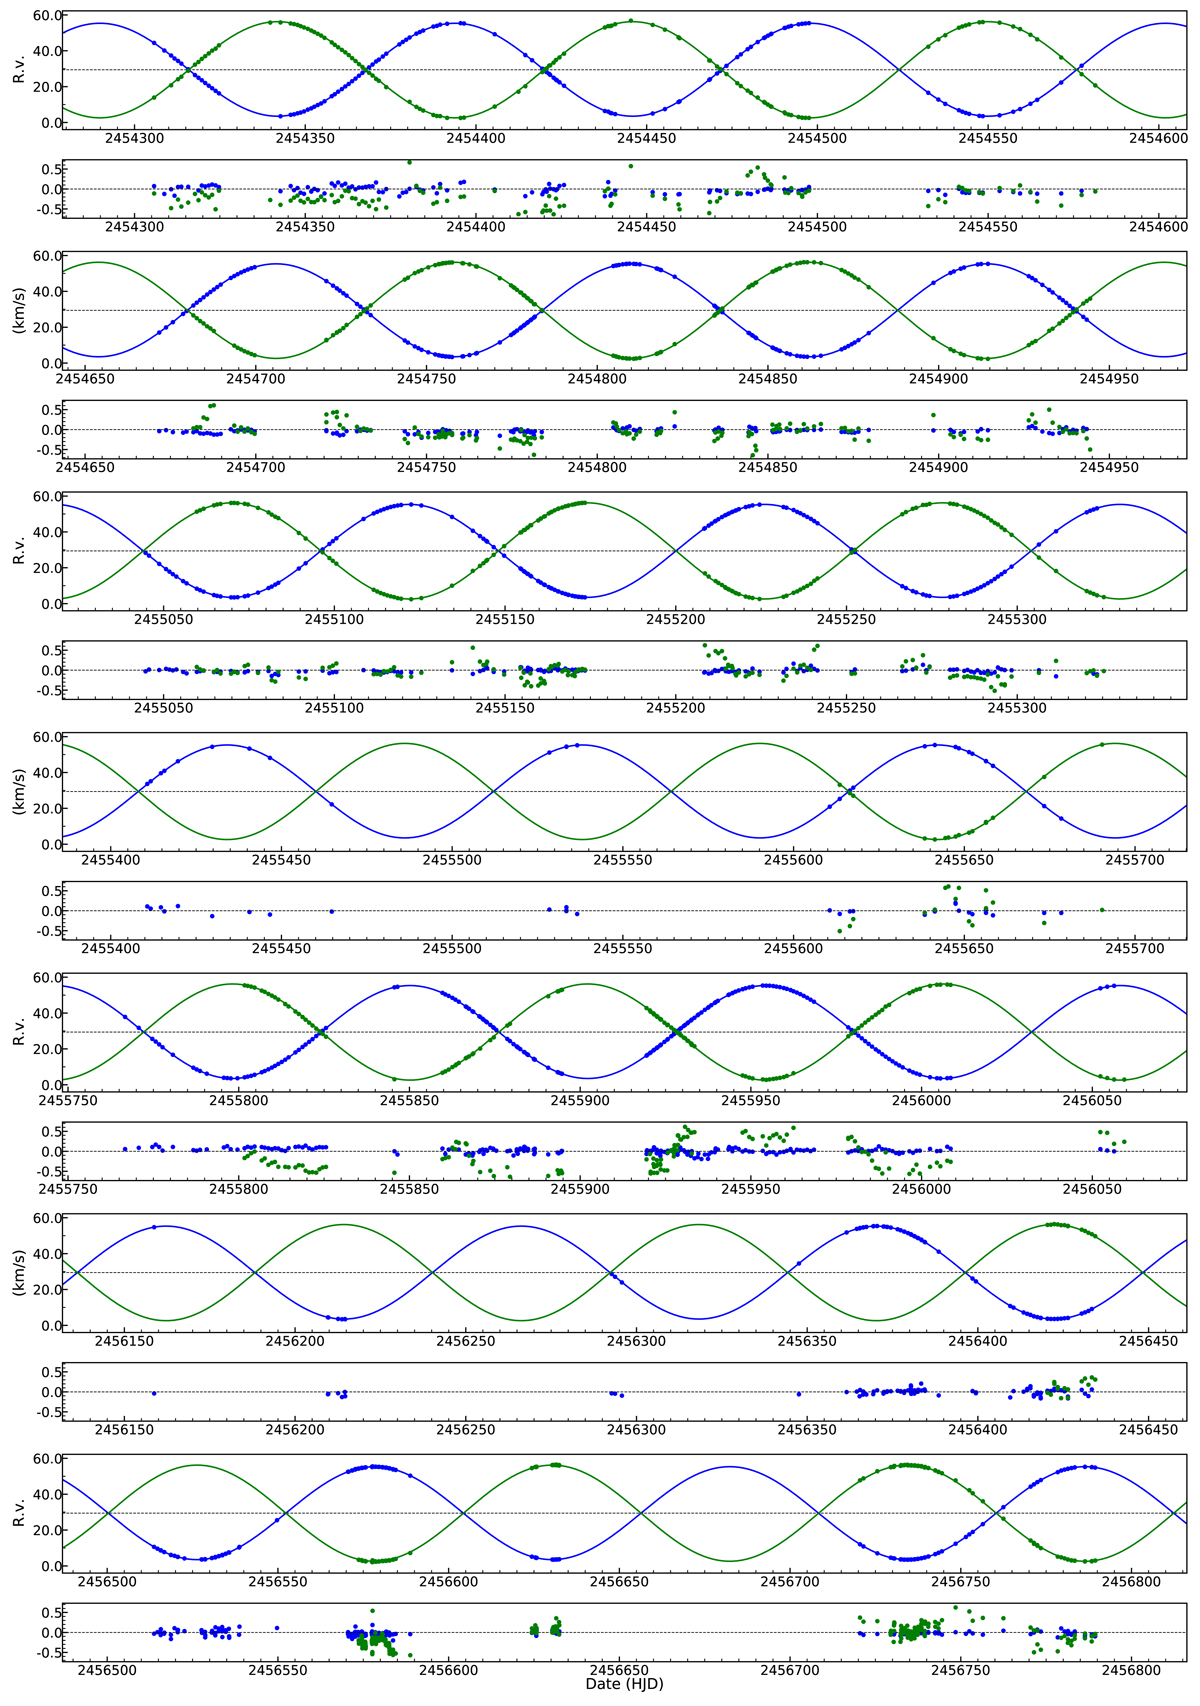
Capella RVs from STELLA compared with our newly computed orbit as a function of time. Points of different color denote the cool and hot component, respectively (blue = primary, green = secondary). The lower of the respective subpanels show the residuals from the orbital fit, same symbols. The residuals in this plot include the systematic errors that were corrected for in the final solution. All panels show RV vs. HJD.
Current usage metrics show cumulative count of Article Views (full-text article views including HTML views, PDF and ePub downloads, according to the available data) and Abstracts Views on Vision4Press platform.
Data correspond to usage on the plateform after 2015. The current usage metrics is available 48-96 hours after online publication and is updated daily on week days.
Initial download of the metrics may take a while.