Free Access
Fig. 17.
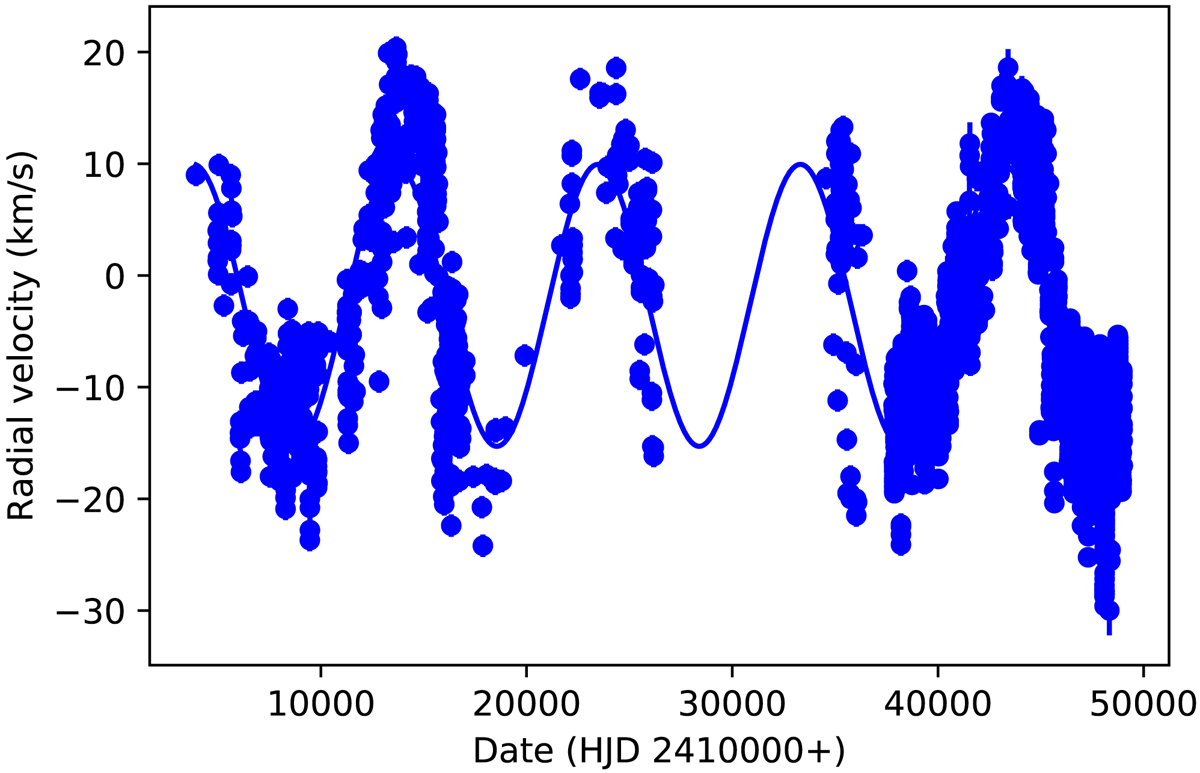
Full set of RVs of ε Aur. Shown as dots are the data collected by Stefanik et al. (2010) and extended by our STELLA RVs from the previous 12 years. The line is the orbital solution from Table 7. The time axis ranges over ≈130 years.
Current usage metrics show cumulative count of Article Views (full-text article views including HTML views, PDF and ePub downloads, according to the available data) and Abstracts Views on Vision4Press platform.
Data correspond to usage on the plateform after 2015. The current usage metrics is available 48-96 hours after online publication and is updated daily on week days.
Initial download of the metrics may take a while.