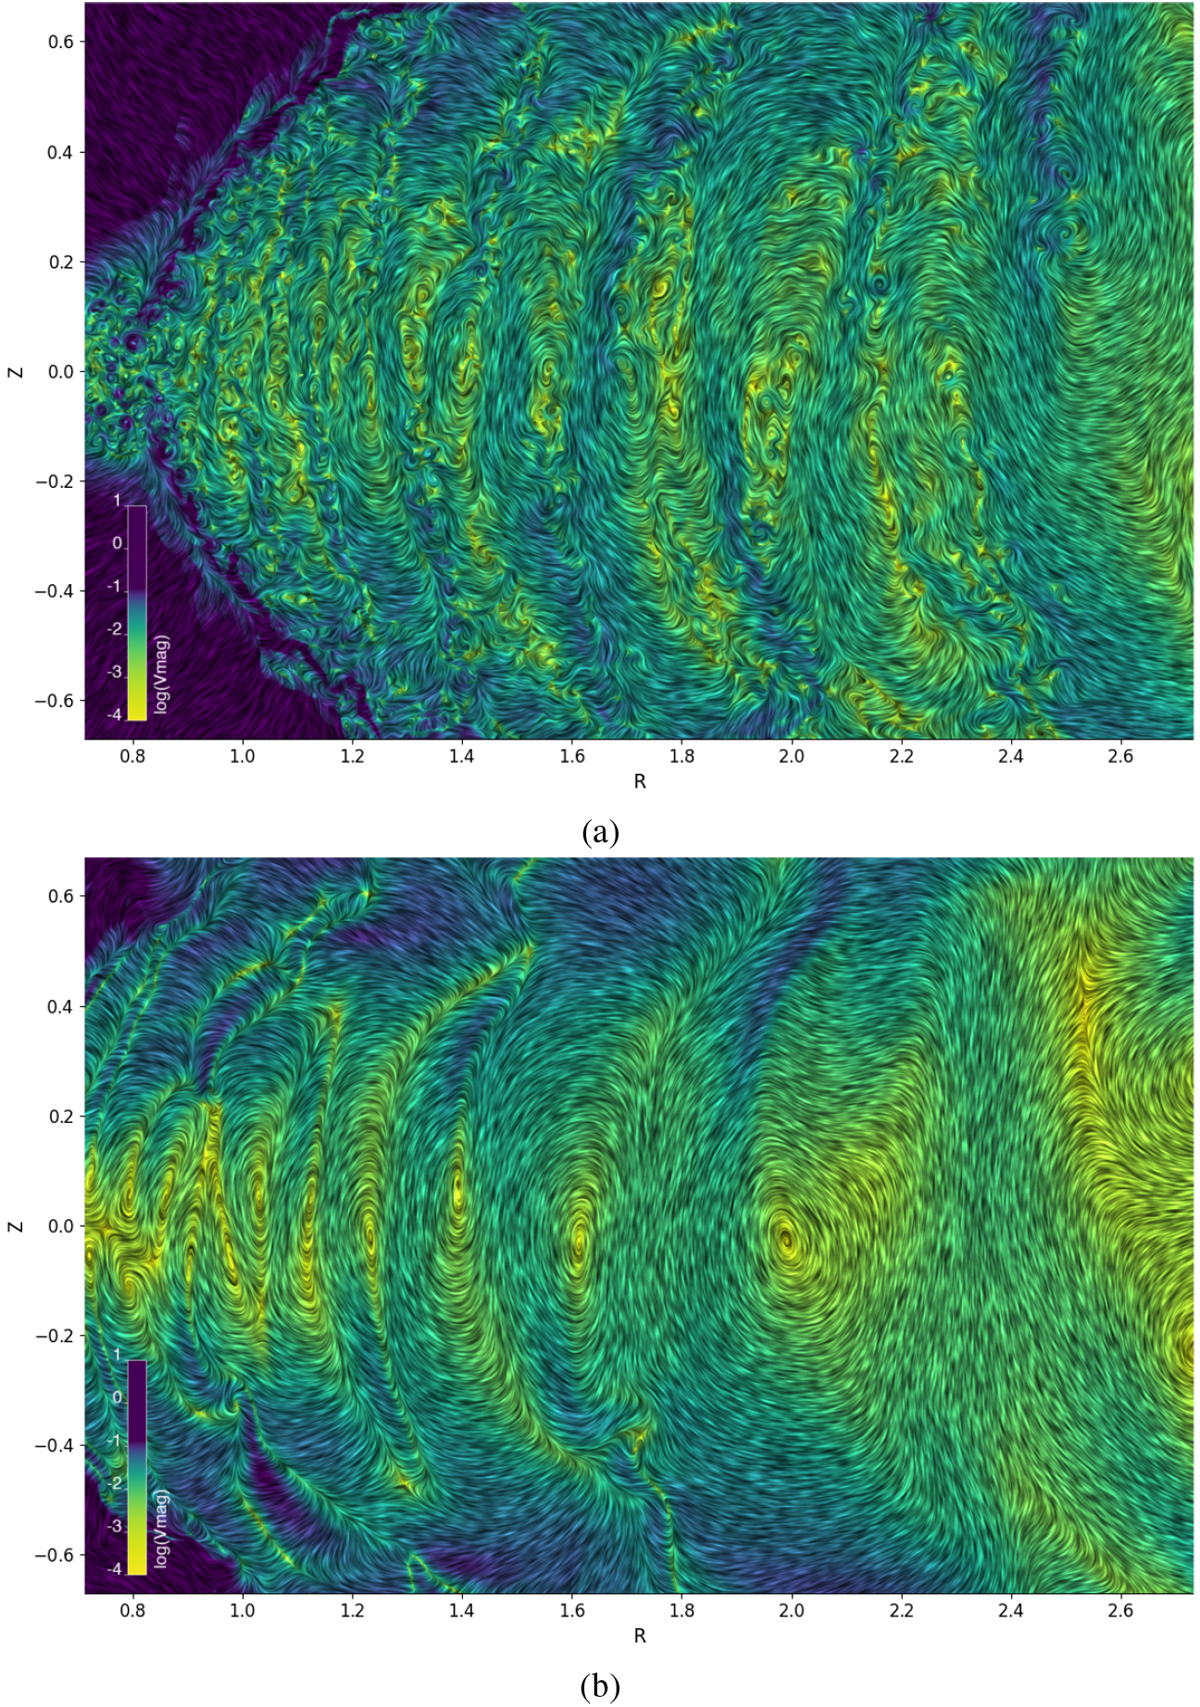
Fig. 7

Snapshot of vmag for the 203 cells per scale height (panel a) compared to the lowest resolution of 25 cells per scale height (panel b) at 200 orbits. The colored contour plot shows vmag and the streamlines show the velocity flow pattern when applying the LIC method. The vmag range (from 0 to 0.2 in code units) is narrowed down to highlight the low-velocity perturbations close to the midplane associated with the VSI.
Current usage metrics show cumulative count of Article Views (full-text article views including HTML views, PDF and ePub downloads, according to the available data) and Abstracts Views on Vision4Press platform.
Data correspond to usage on the plateform after 2015. The current usage metrics is available 48-96 hours after online publication and is updated daily on week days.
Initial download of the metrics may take a while.


