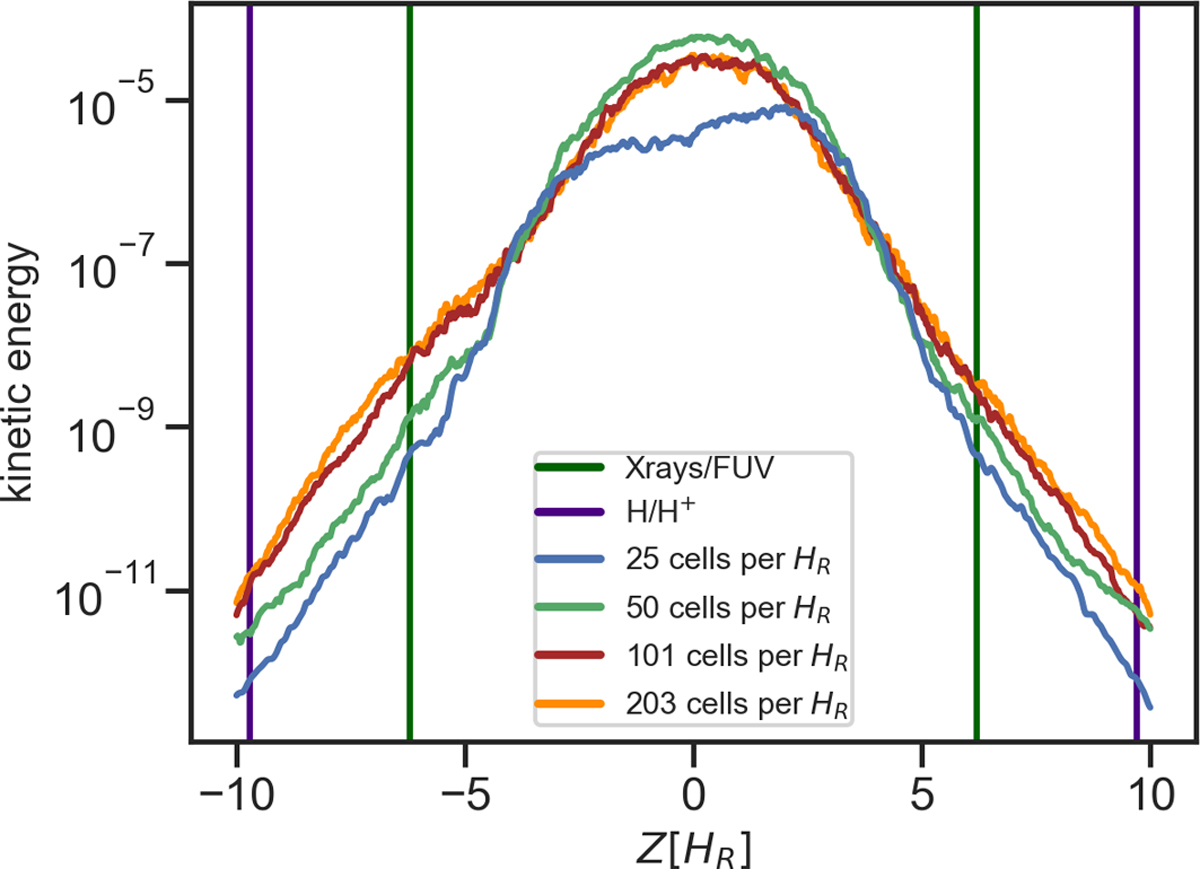
Fig. 4

Averaged profile of the local kinetic energy normalized with respect to the kinetic energy in the midplane for the 25, 50, 101, and 203 cells per HR at R0 = 1 AU. Thevertical colored lines represent HR = 6.2, where the X-ray–FUV heated boundary layer is (in dark green), and the HR = 9.7, where the EUV heated region is located (in purple) (same as in Fig. 2). The models for 101 and 203 cells per HR are in good agreement. The density floor is located HR = 13, and therefore does not influence our result.
Current usage metrics show cumulative count of Article Views (full-text article views including HTML views, PDF and ePub downloads, according to the available data) and Abstracts Views on Vision4Press platform.
Data correspond to usage on the plateform after 2015. The current usage metrics is available 48-96 hours after online publication and is updated daily on week days.
Initial download of the metrics may take a while.


