Open Access
Fig. 3
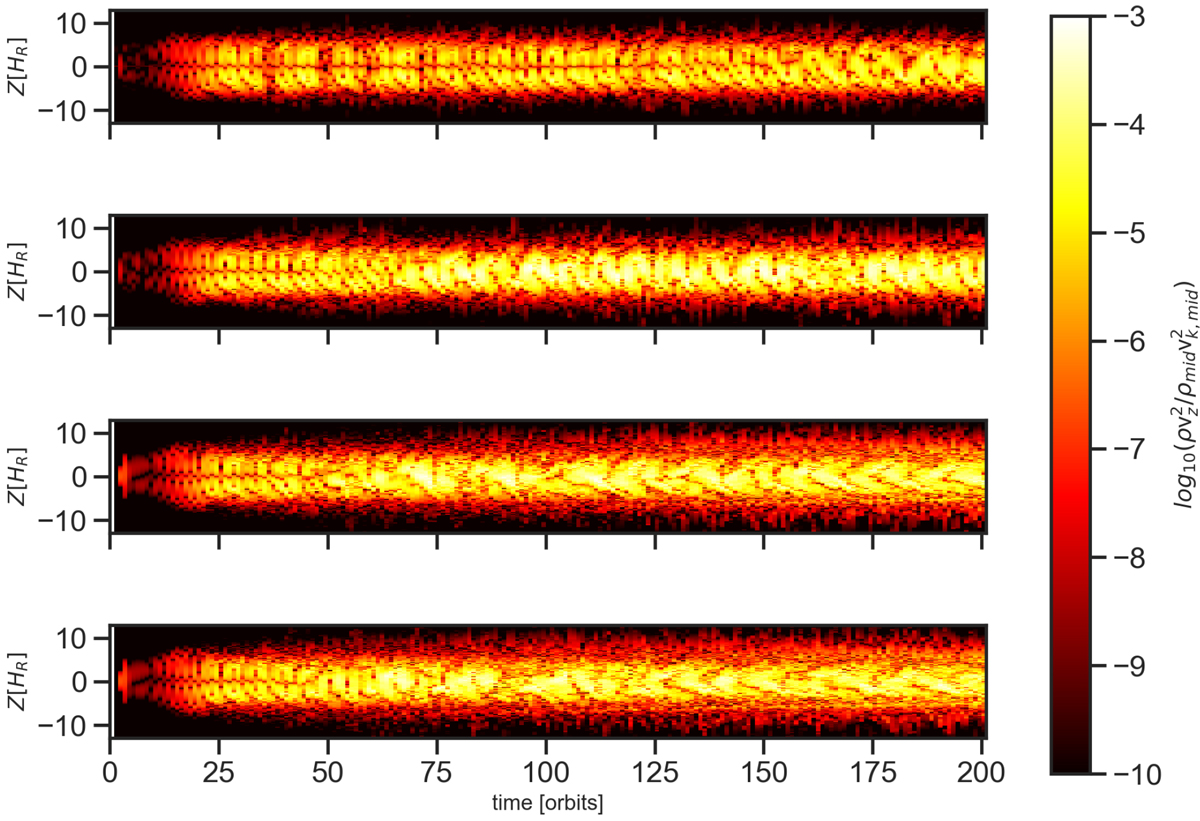
Time-evolution of the local kinetic energy at R0 = 1 over height for different resolutions (from top to bottom: 25, 50, 101, 203 cells per scale height). The local kinetic energy is normalized to the global kinetic energy (see Eq. (8)).
Current usage metrics show cumulative count of Article Views (full-text article views including HTML views, PDF and ePub downloads, according to the available data) and Abstracts Views on Vision4Press platform.
Data correspond to usage on the plateform after 2015. The current usage metrics is available 48-96 hours after online publication and is updated daily on week days.
Initial download of the metrics may take a while.