Fig. A.2.
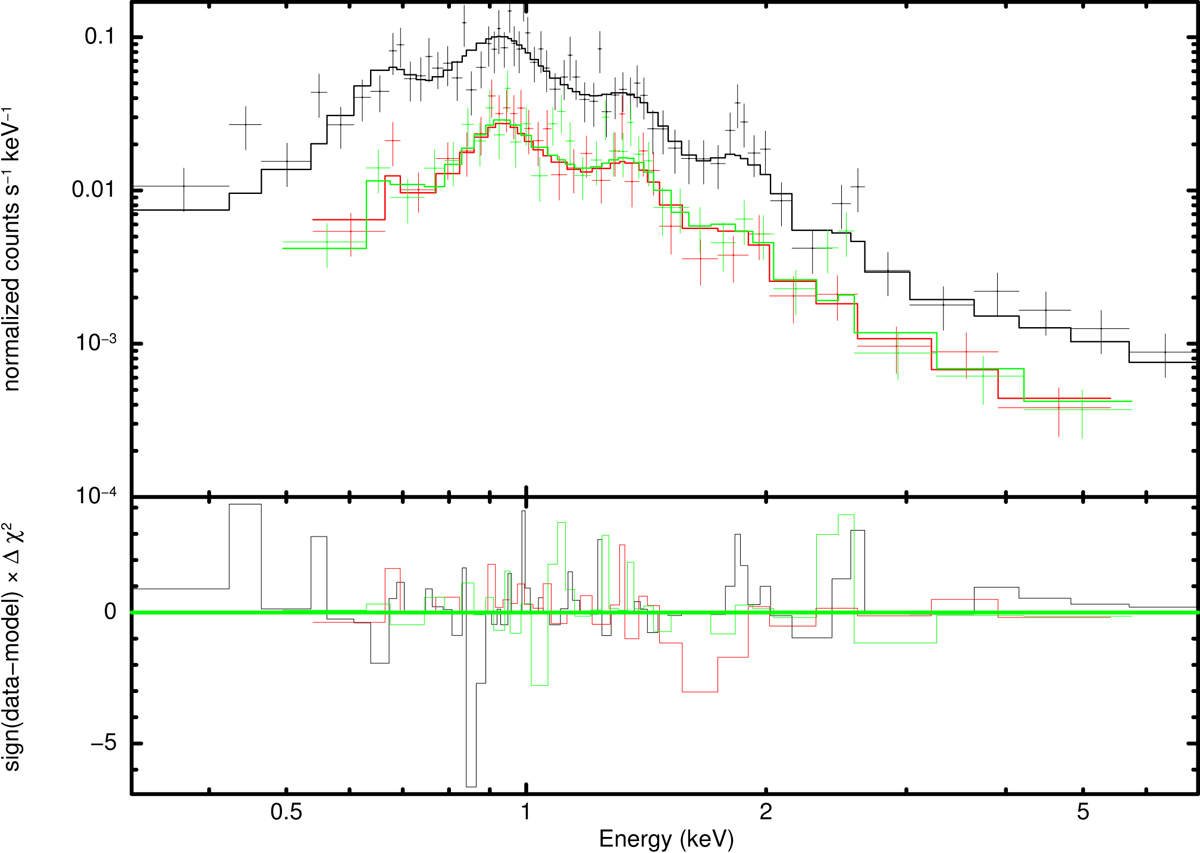
Low-resolution X-ray spectra of the central star in IRAS 00500+6713. The EPIC pn (black data points), MOS1 (red data points), and MOS2 (green data points) spectra that were merged over the full exposure time are displayed. The black, red, and green histograms show the best fitting model of a two-temperature plasma and a nonthermal component as well as the residuals as signed contributions.
Current usage metrics show cumulative count of Article Views (full-text article views including HTML views, PDF and ePub downloads, according to the available data) and Abstracts Views on Vision4Press platform.
Data correspond to usage on the plateform after 2015. The current usage metrics is available 48-96 hours after online publication and is updated daily on week days.
Initial download of the metrics may take a while.