Fig. A.1.
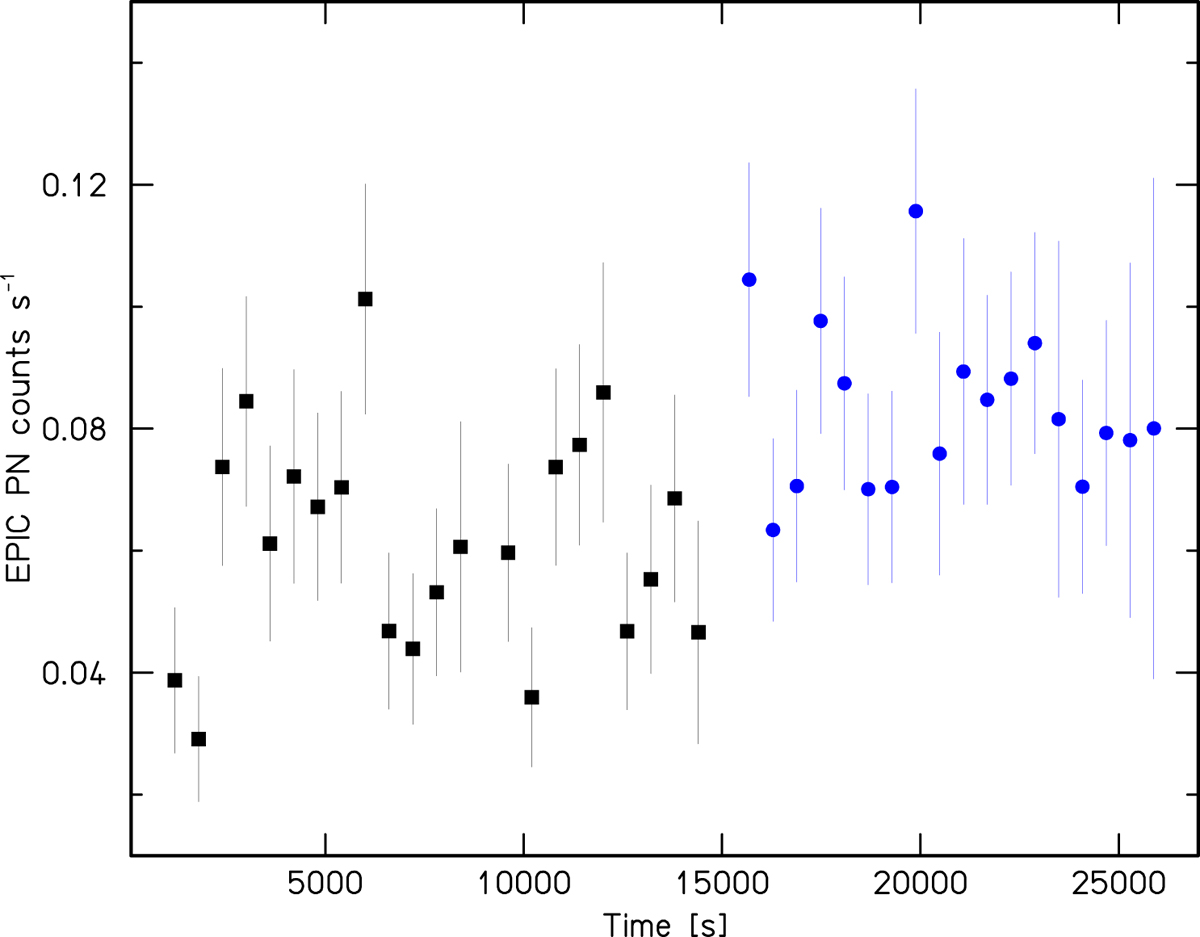
XMM-Newton EPIC pn light curve of the central star in IRAS 00500+6713. The light-curve was background corrected and binned by 600 s; the error bars correspond to 3σ. The Y-axis is the time after the start of the observation. Black and blue data points refer to the first and second observation, respectively (see Table A.1). For the second observation, the X-axis is shifted by 15 000 s for clarity.
Current usage metrics show cumulative count of Article Views (full-text article views including HTML views, PDF and ePub downloads, according to the available data) and Abstracts Views on Vision4Press platform.
Data correspond to usage on the plateform after 2015. The current usage metrics is available 48-96 hours after online publication and is updated daily on week days.
Initial download of the metrics may take a while.