Fig. 9.
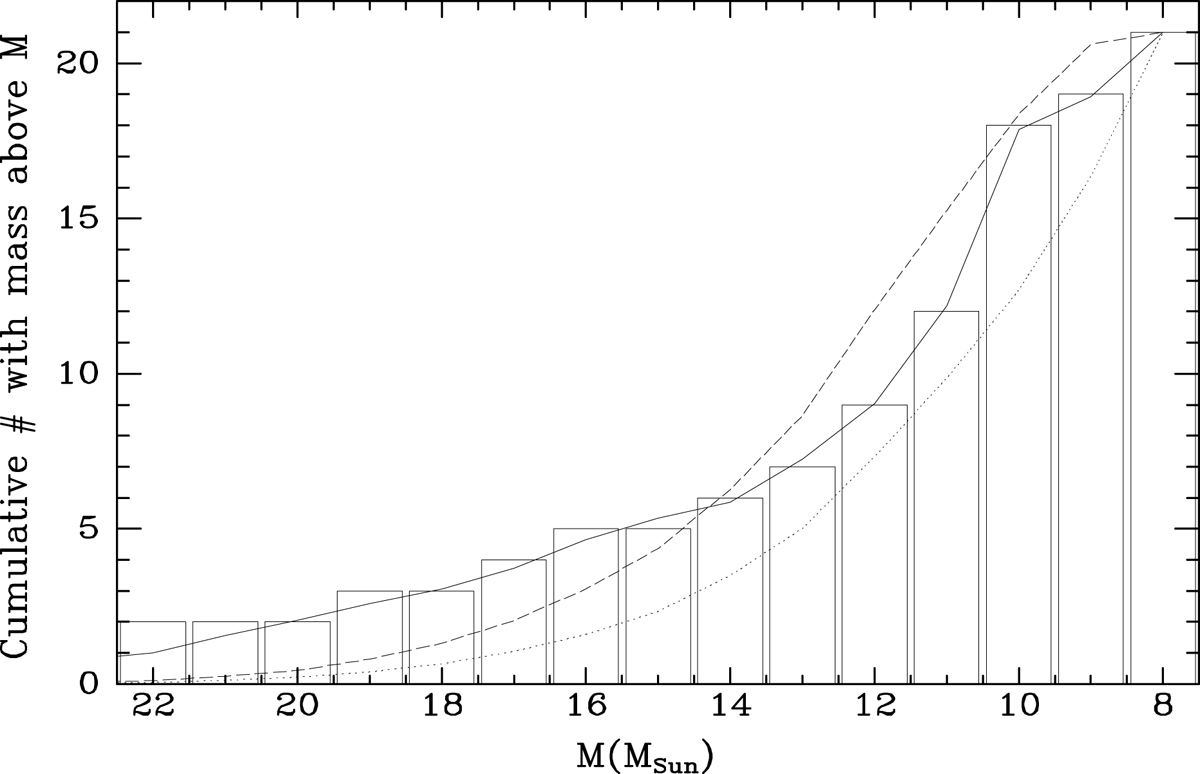
Cumulative histogram of masses of the 24 red supergiants in Cygnus identified in this work. The solid line shows the corresponding best-fit cumulative histogram derived from the star formation history depicted in Fig. 4.4. For reference, the predicted cumulative histograms obtained assuming a constant star formation rate (dotted line) and a star formation rate increasing linearly with time (dashed line) are shown as well.
Current usage metrics show cumulative count of Article Views (full-text article views including HTML views, PDF and ePub downloads, according to the available data) and Abstracts Views on Vision4Press platform.
Data correspond to usage on the plateform after 2015. The current usage metrics is available 48-96 hours after online publication and is updated daily on week days.
Initial download of the metrics may take a while.