Fig. 6.
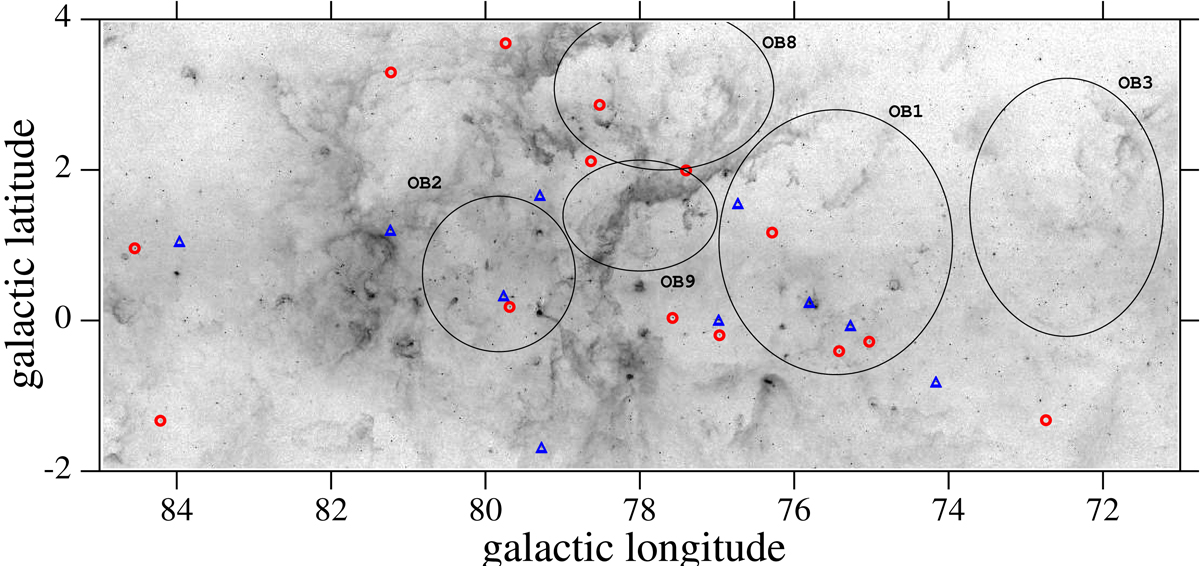
Spatial distribution of the red supergiants belonging to the Cygnus region, overplotted on a mosaic of infrared images obtained by the Midcourse Space Experiment (MSX) satellite in the infrared band A (6.0−10.9 μm) that outlines the distribution of warm dust. Blue triangles indicate the positions of stars younger than 20 Myr, and red circles those of older stars. The approximate boundaries of present-day associations as listed by Uyanıker et al. (2001) are indicated. The pervading nebulosity between l ≃ 77° and l ≃ 83° outlines the Cygnus X molecular complex.
Current usage metrics show cumulative count of Article Views (full-text article views including HTML views, PDF and ePub downloads, according to the available data) and Abstracts Views on Vision4Press platform.
Data correspond to usage on the plateform after 2015. The current usage metrics is available 48-96 hours after online publication and is updated daily on week days.
Initial download of the metrics may take a while.