Free Access
Fig. 6
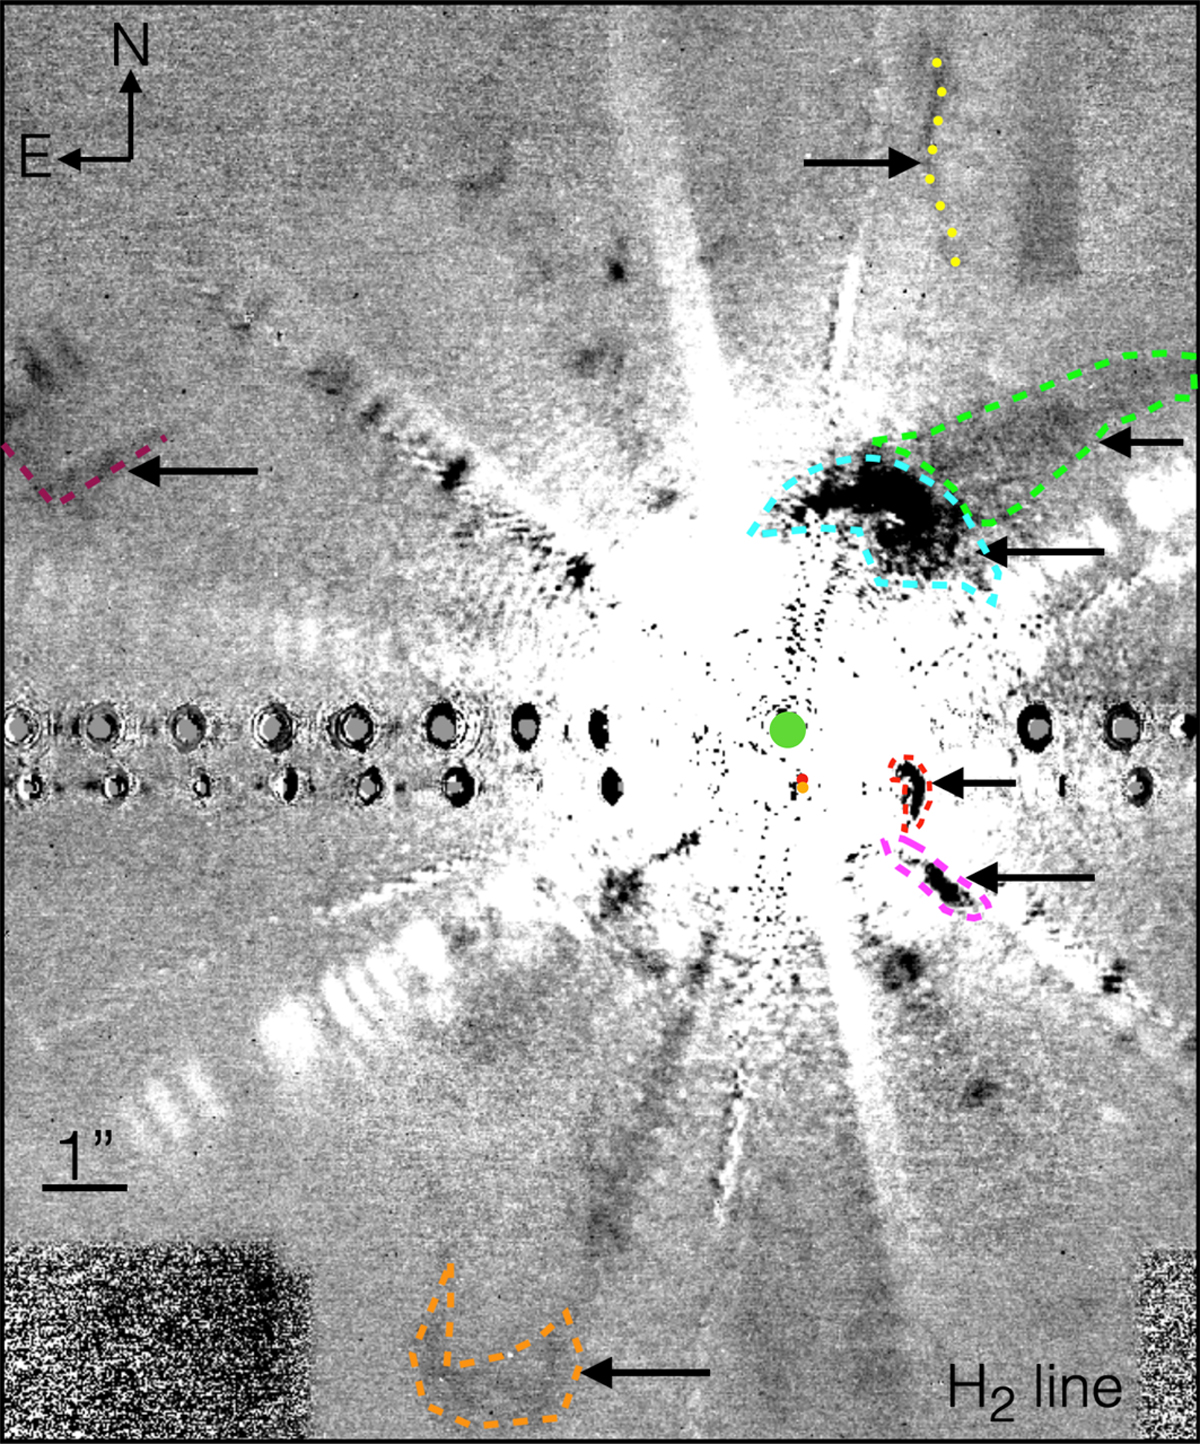
T Tauri H2 line emission map obtained with LBT-LUCI in October 2016. Only features which cannot be explained by image processing artifacts are indicated and discussed in the text. The positions of the stars are indicated by colored dots (T Tauri N, Sa,and Sb are in green, orange, and red, respectively).
Current usage metrics show cumulative count of Article Views (full-text article views including HTML views, PDF and ePub downloads, according to the available data) and Abstracts Views on Vision4Press platform.
Data correspond to usage on the plateform after 2015. The current usage metrics is available 48-96 hours after online publication and is updated daily on week days.
Initial download of the metrics may take a while.