Fig. 1
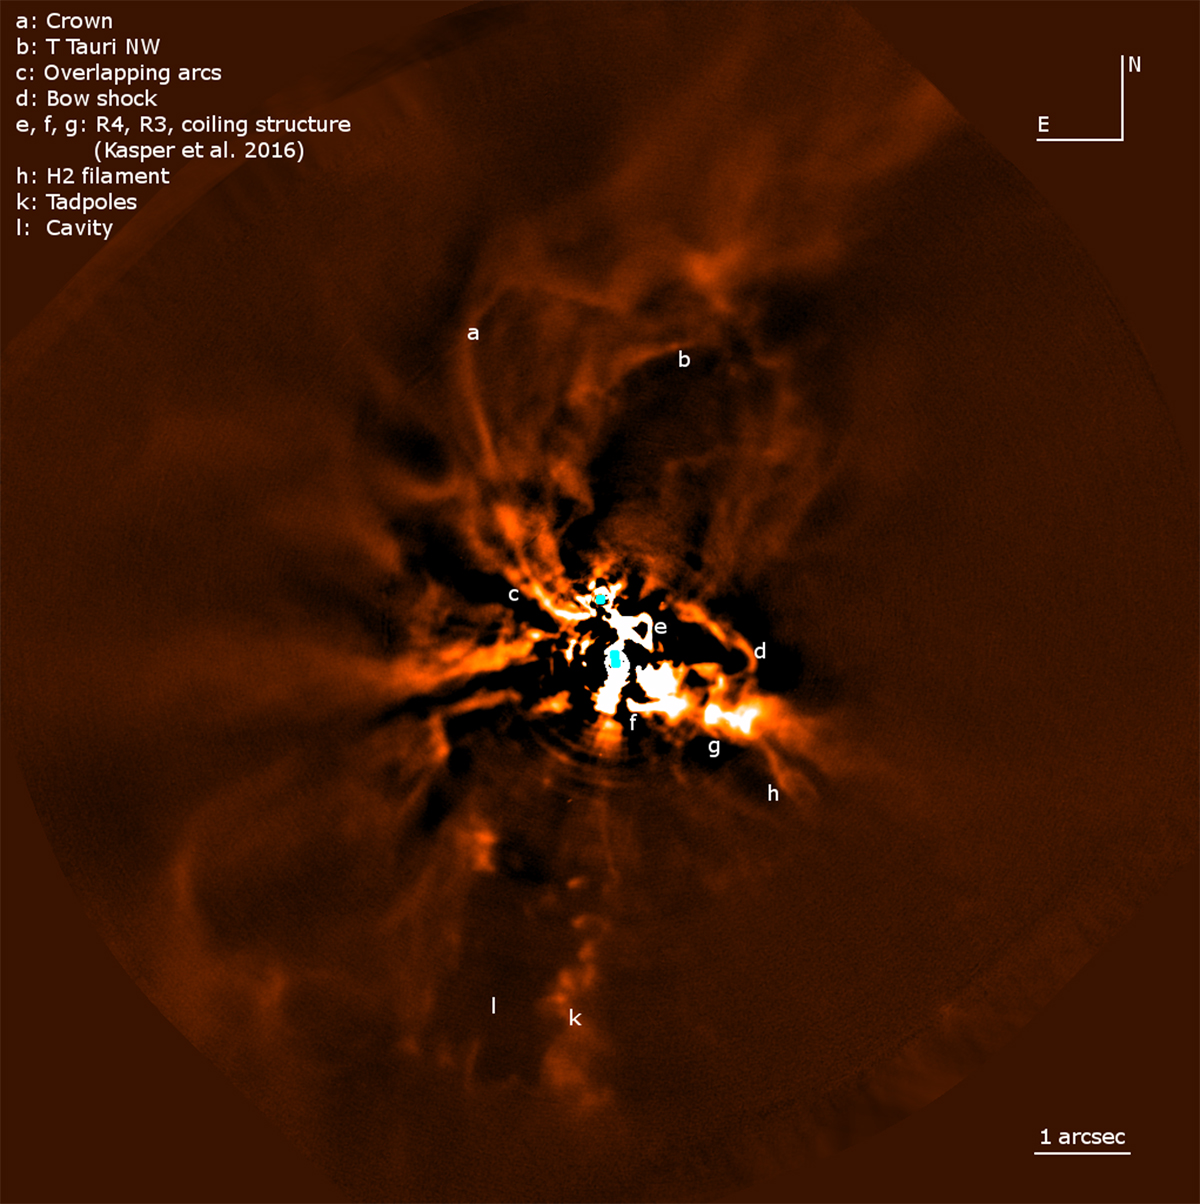
SPHERE-IRDIS classical ADI image of T Tauri in the K1-filter in linear scale. The image combines data recorded in November 2017 and January 2018. New features and some known ones (such as T Tauri NW) are labeled in the image. The stars are either suppressed by the coronagraph (T Tauri N) or saturated by the color-scale (T Tauri Sa and Sb); their positions are indicated by the cyan dots. The dark patches are artifacts from the ADI processing. The main spatial structures discussed in this paper are indicated.
Current usage metrics show cumulative count of Article Views (full-text article views including HTML views, PDF and ePub downloads, according to the available data) and Abstracts Views on Vision4Press platform.
Data correspond to usage on the plateform after 2015. The current usage metrics is available 48-96 hours after online publication and is updated daily on week days.
Initial download of the metrics may take a while.