Fig. 14
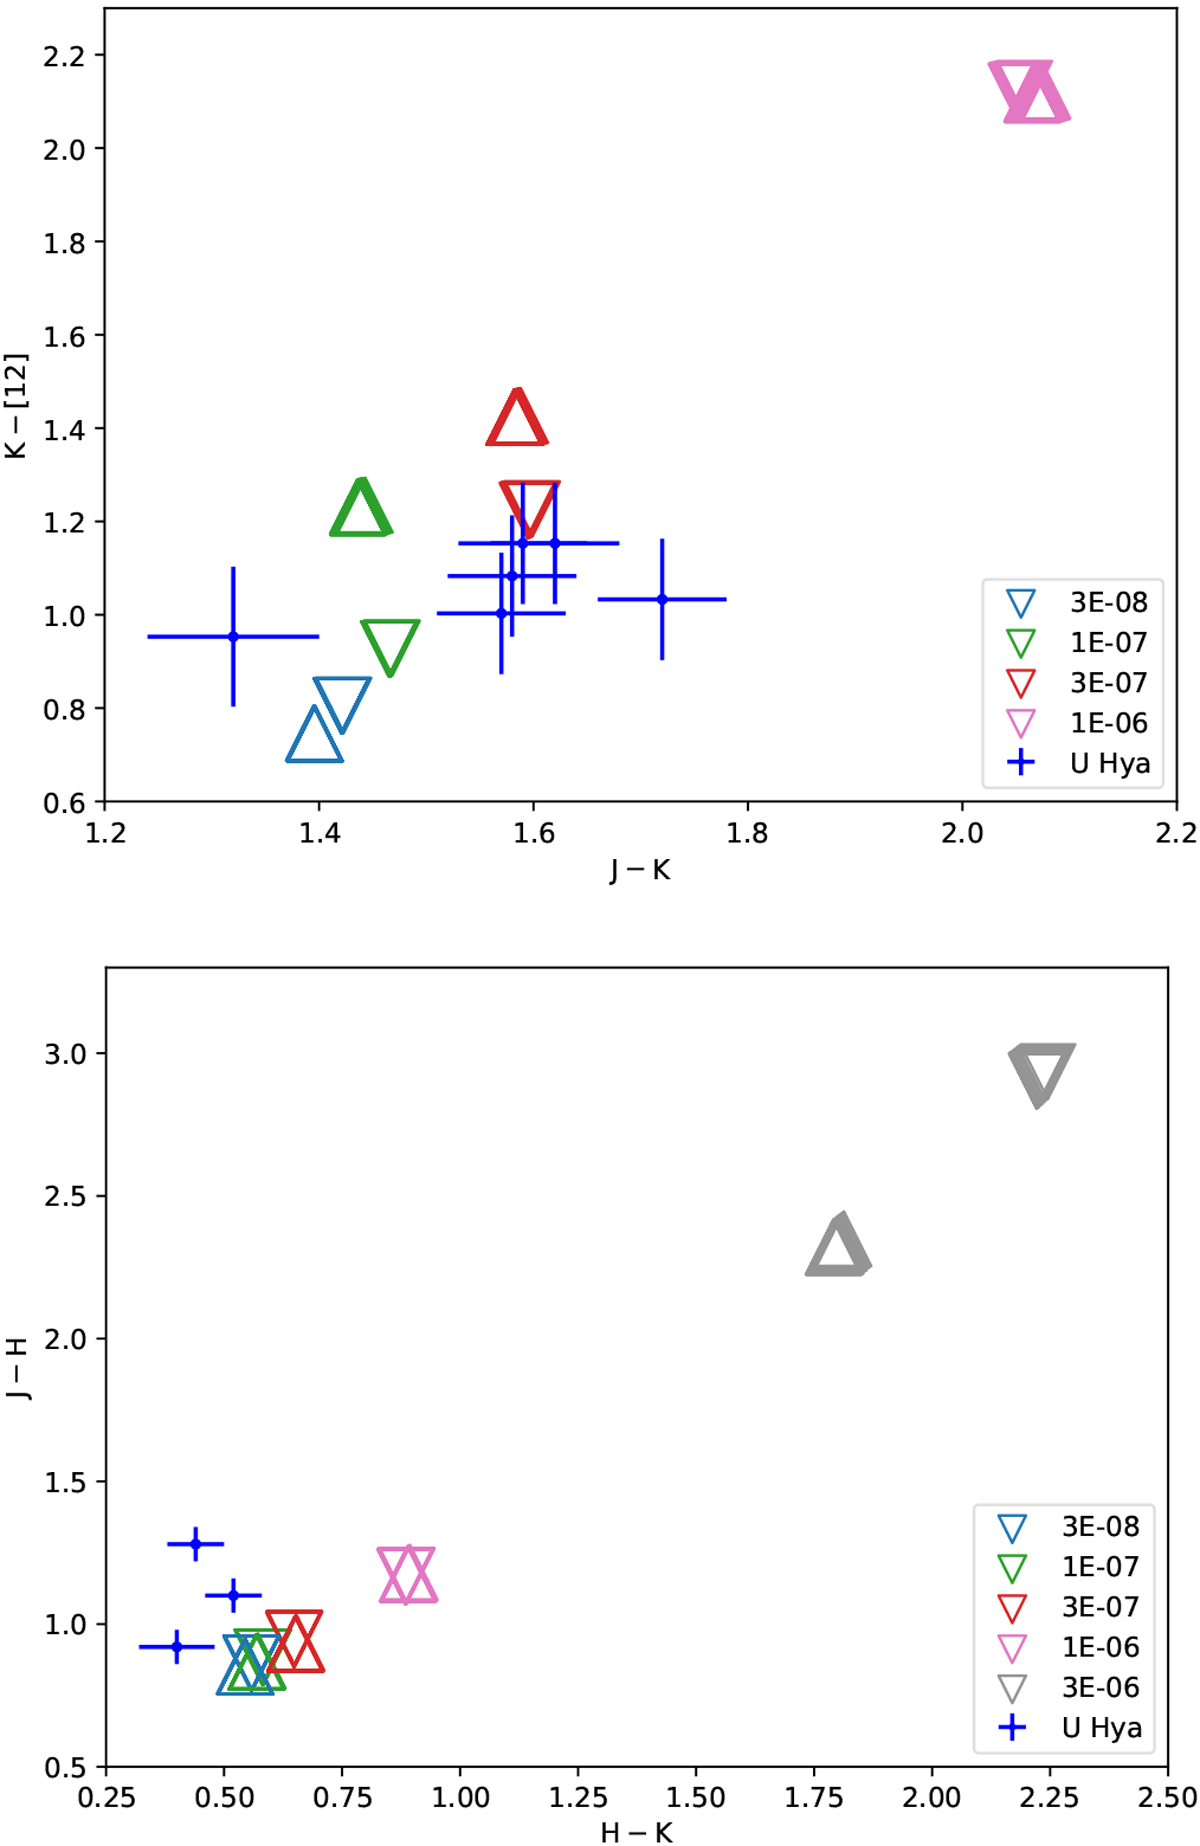
Colour–colour diagrams of U Hya derived from the stationary wind models. The coloured triangles represent the individual models with their respective present day total mass-loss rates (in M⊙ yr−1). The uprighttriangles are models with high, the downward facing ones with low initial outflow velocity (see text). Blue dots with errorbars indicate observed values from the literature (see Table 2).
Current usage metrics show cumulative count of Article Views (full-text article views including HTML views, PDF and ePub downloads, according to the available data) and Abstracts Views on Vision4Press platform.
Data correspond to usage on the plateform after 2015. The current usage metrics is available 48-96 hours after online publication and is updated daily on week days.
Initial download of the metrics may take a while.