Free Access
Fig. 11
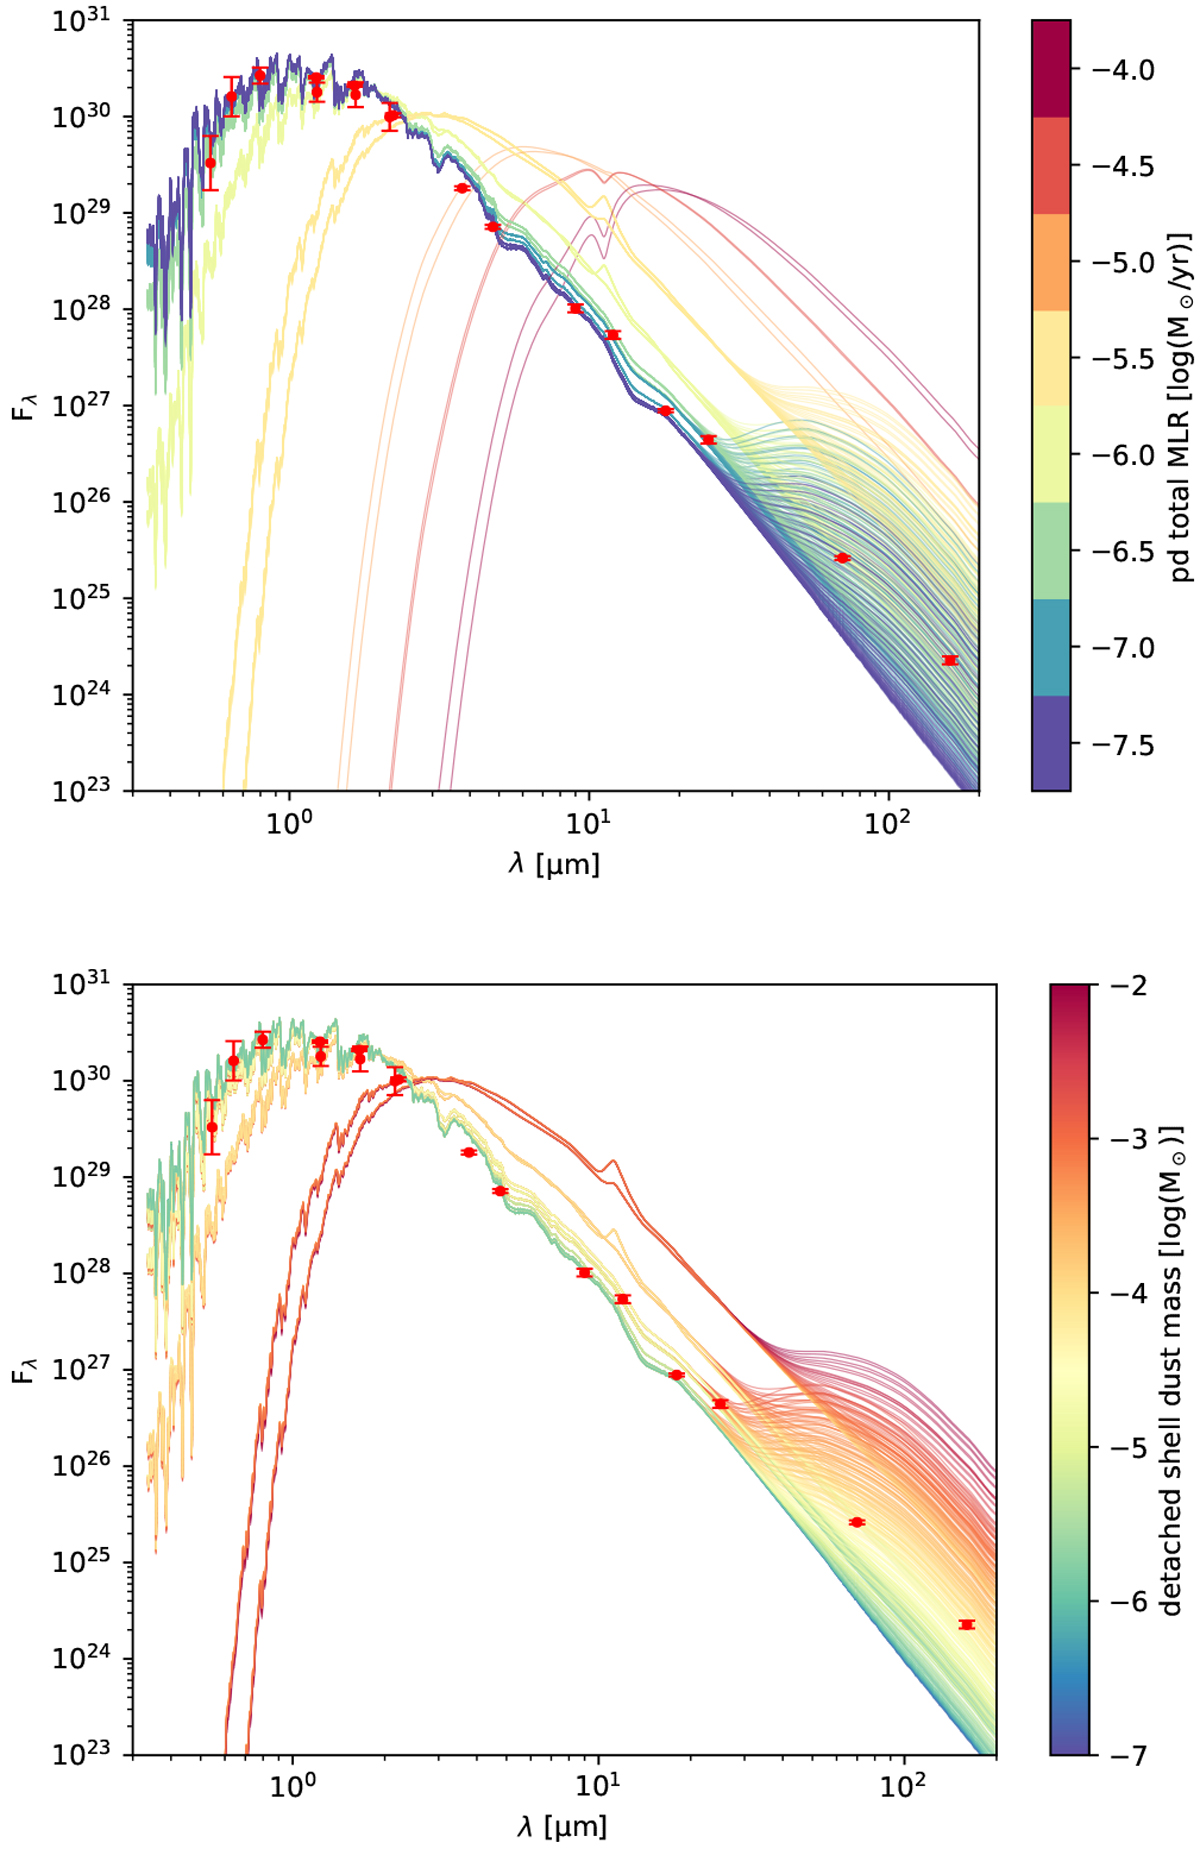
Model spectra based on combined stationary wind models for U Hya. The line colours indicate the total present day mass-loss rate (top) and the variation in total mass contained in the detached shell (bottom). Red symbols are photometricobservations with their respective error bars.
Current usage metrics show cumulative count of Article Views (full-text article views including HTML views, PDF and ePub downloads, according to the available data) and Abstracts Views on Vision4Press platform.
Data correspond to usage on the plateform after 2015. The current usage metrics is available 48-96 hours after online publication and is updated daily on week days.
Initial download of the metrics may take a while.