Free Access
Fig. 1
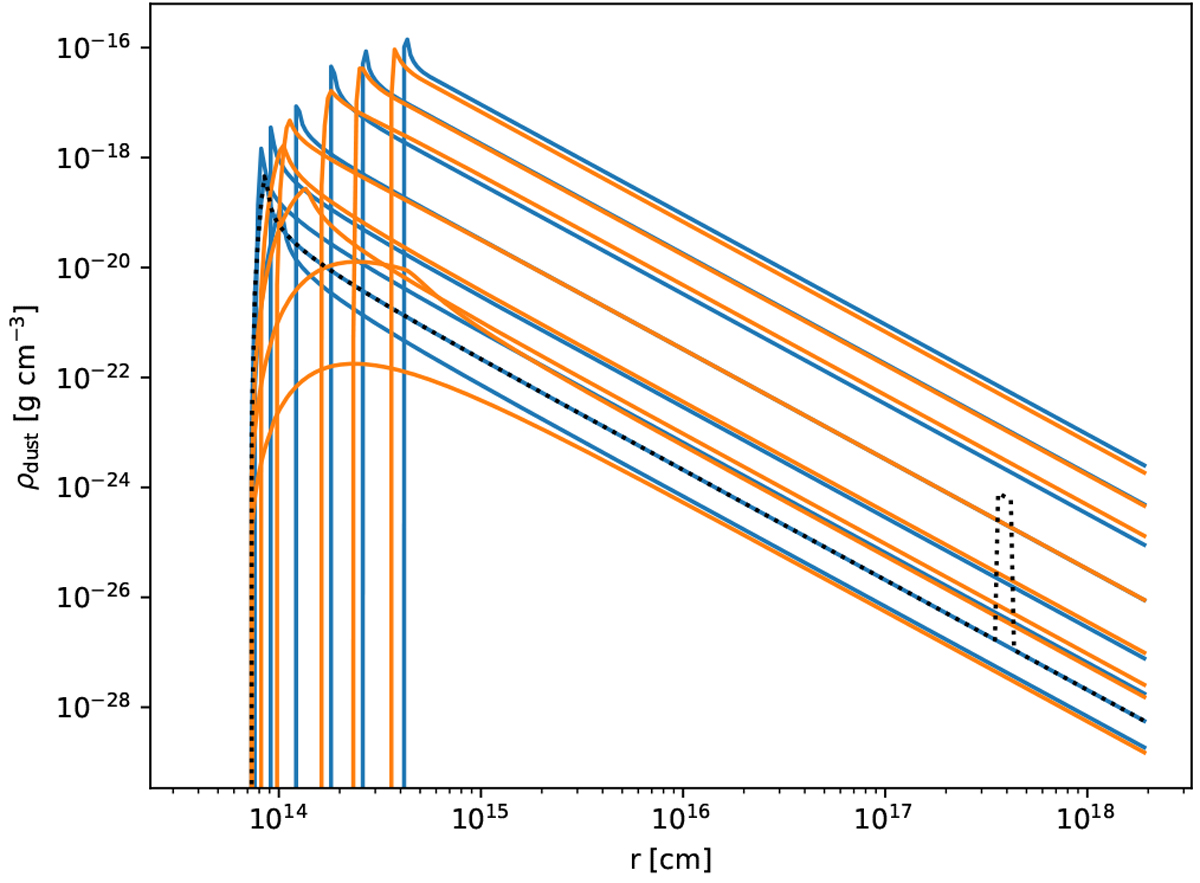
Dust-density profiles of the baseline stationary wind models with varying MLRs. Blue and orange indicate low (0.5 km s−1) and high (1.5 km s−1) initial outflow velocity, respectively. The dotted line is a model with detached shell, where the density is scaled by a factor of 500.
Current usage metrics show cumulative count of Article Views (full-text article views including HTML views, PDF and ePub downloads, according to the available data) and Abstracts Views on Vision4Press platform.
Data correspond to usage on the plateform after 2015. The current usage metrics is available 48-96 hours after online publication and is updated daily on week days.
Initial download of the metrics may take a while.