Fig. B.1.
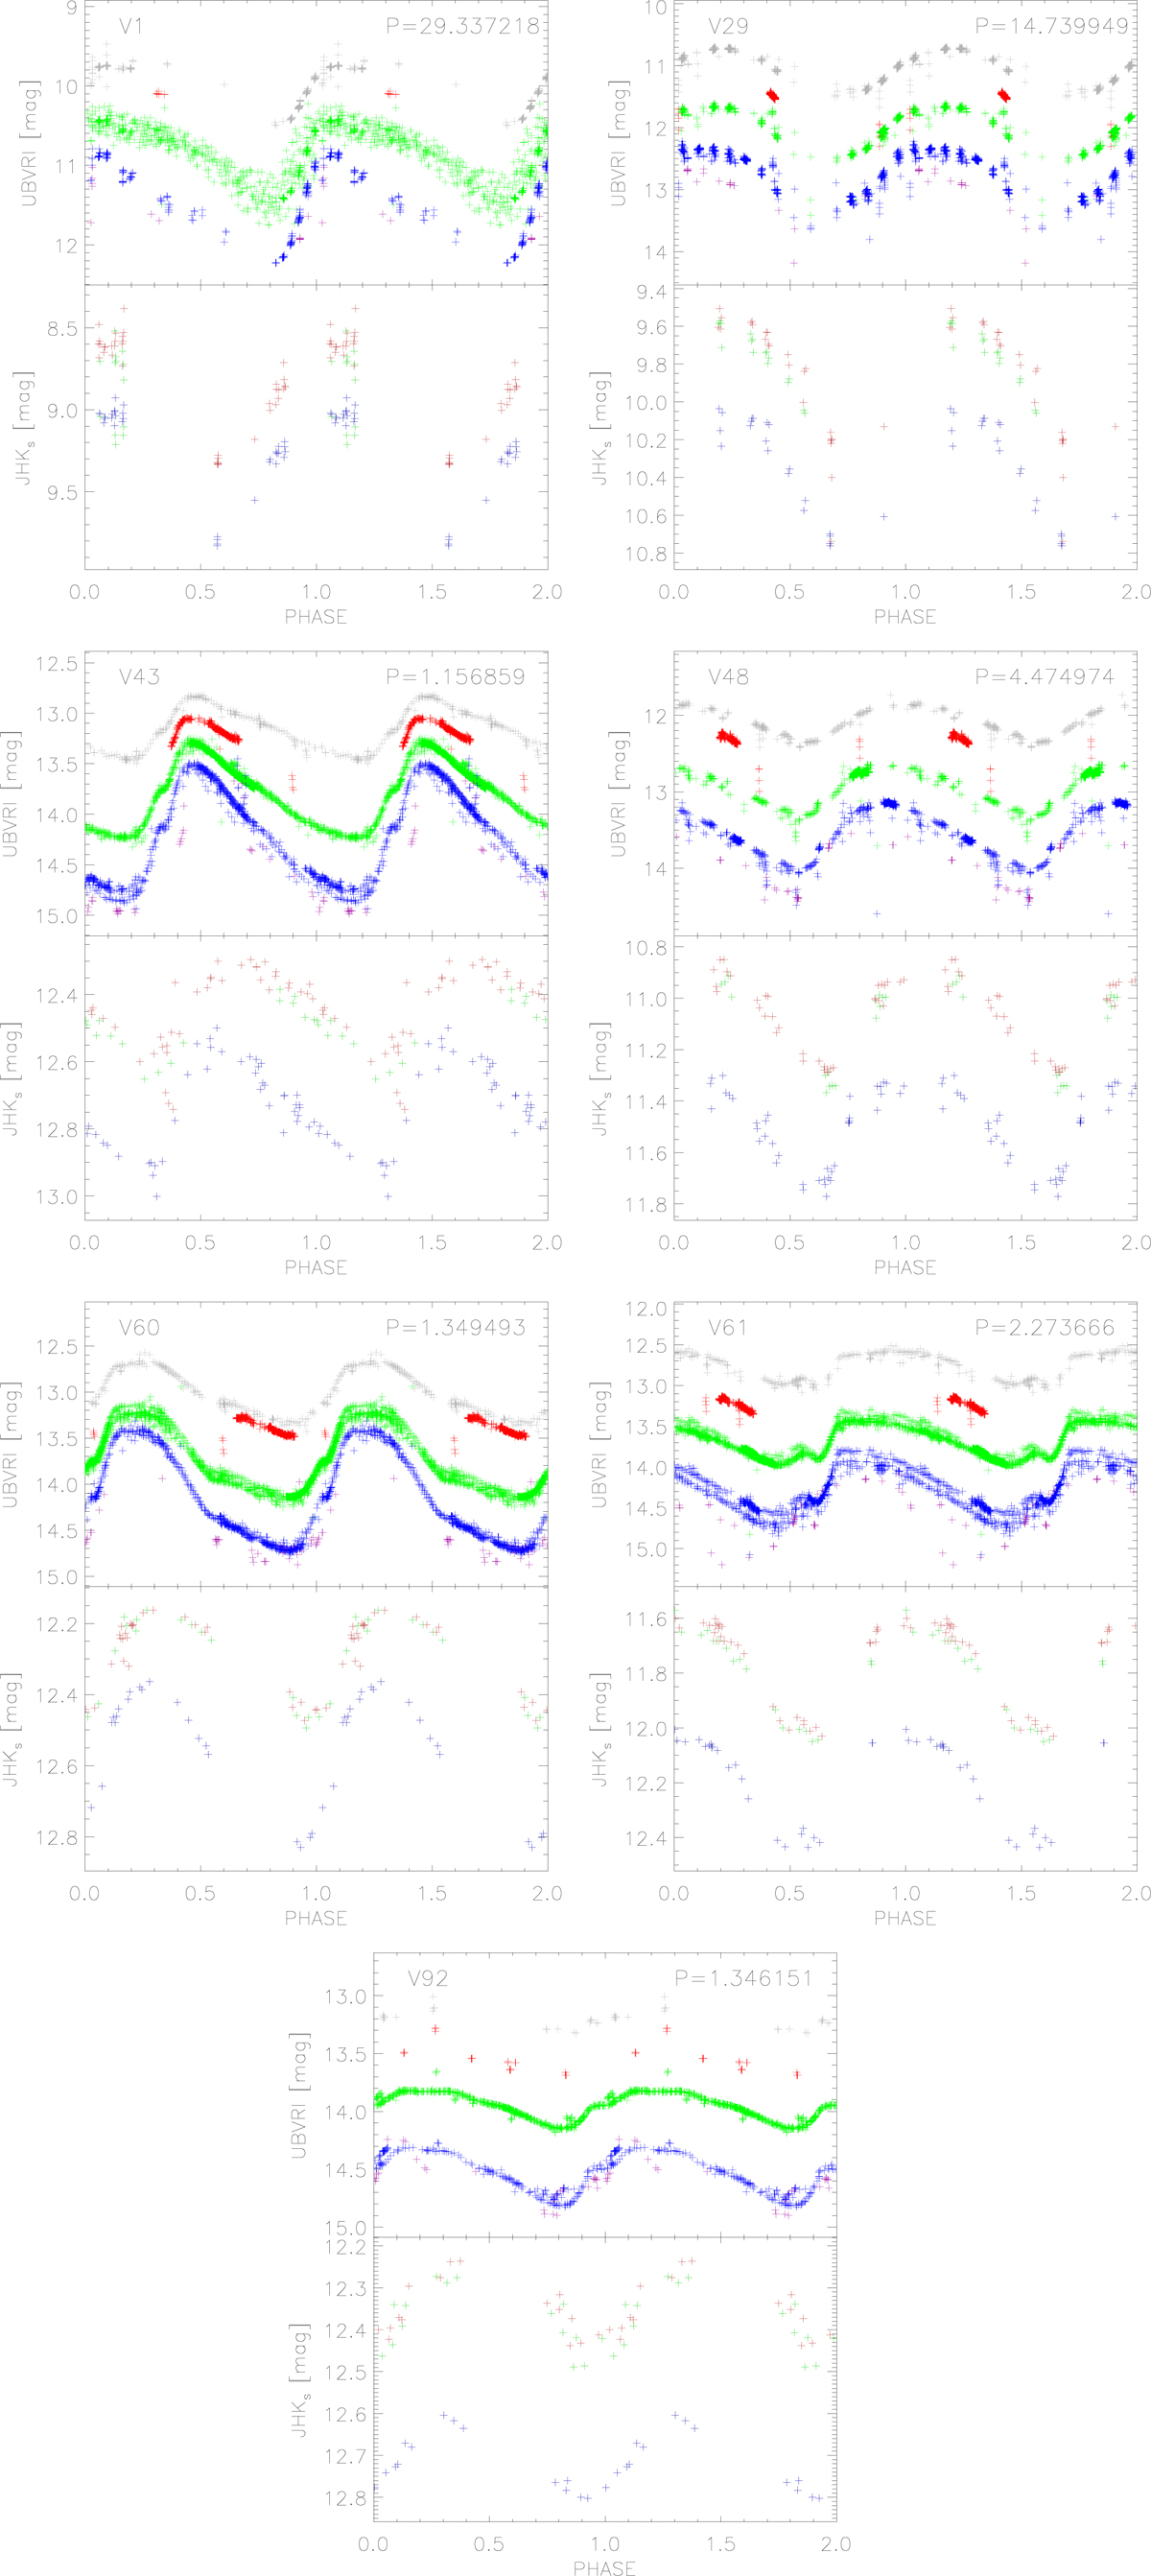
Top panels: optical light curves of the T2Cs of ω Cen. Purple sbows U, blue presents B, green shows V, red indicates R, and gray presents I. Names and periods are labeled in the top left and top right corners, respectively. Bottom panels: NIR light curves of the T2Cs of ω Cen. Blue shows J, green presents H, and red shows Ks.
Current usage metrics show cumulative count of Article Views (full-text article views including HTML views, PDF and ePub downloads, according to the available data) and Abstracts Views on Vision4Press platform.
Data correspond to usage on the plateform after 2015. The current usage metrics is available 48-96 hours after online publication and is updated daily on week days.
Initial download of the metrics may take a while.