Fig. 8.
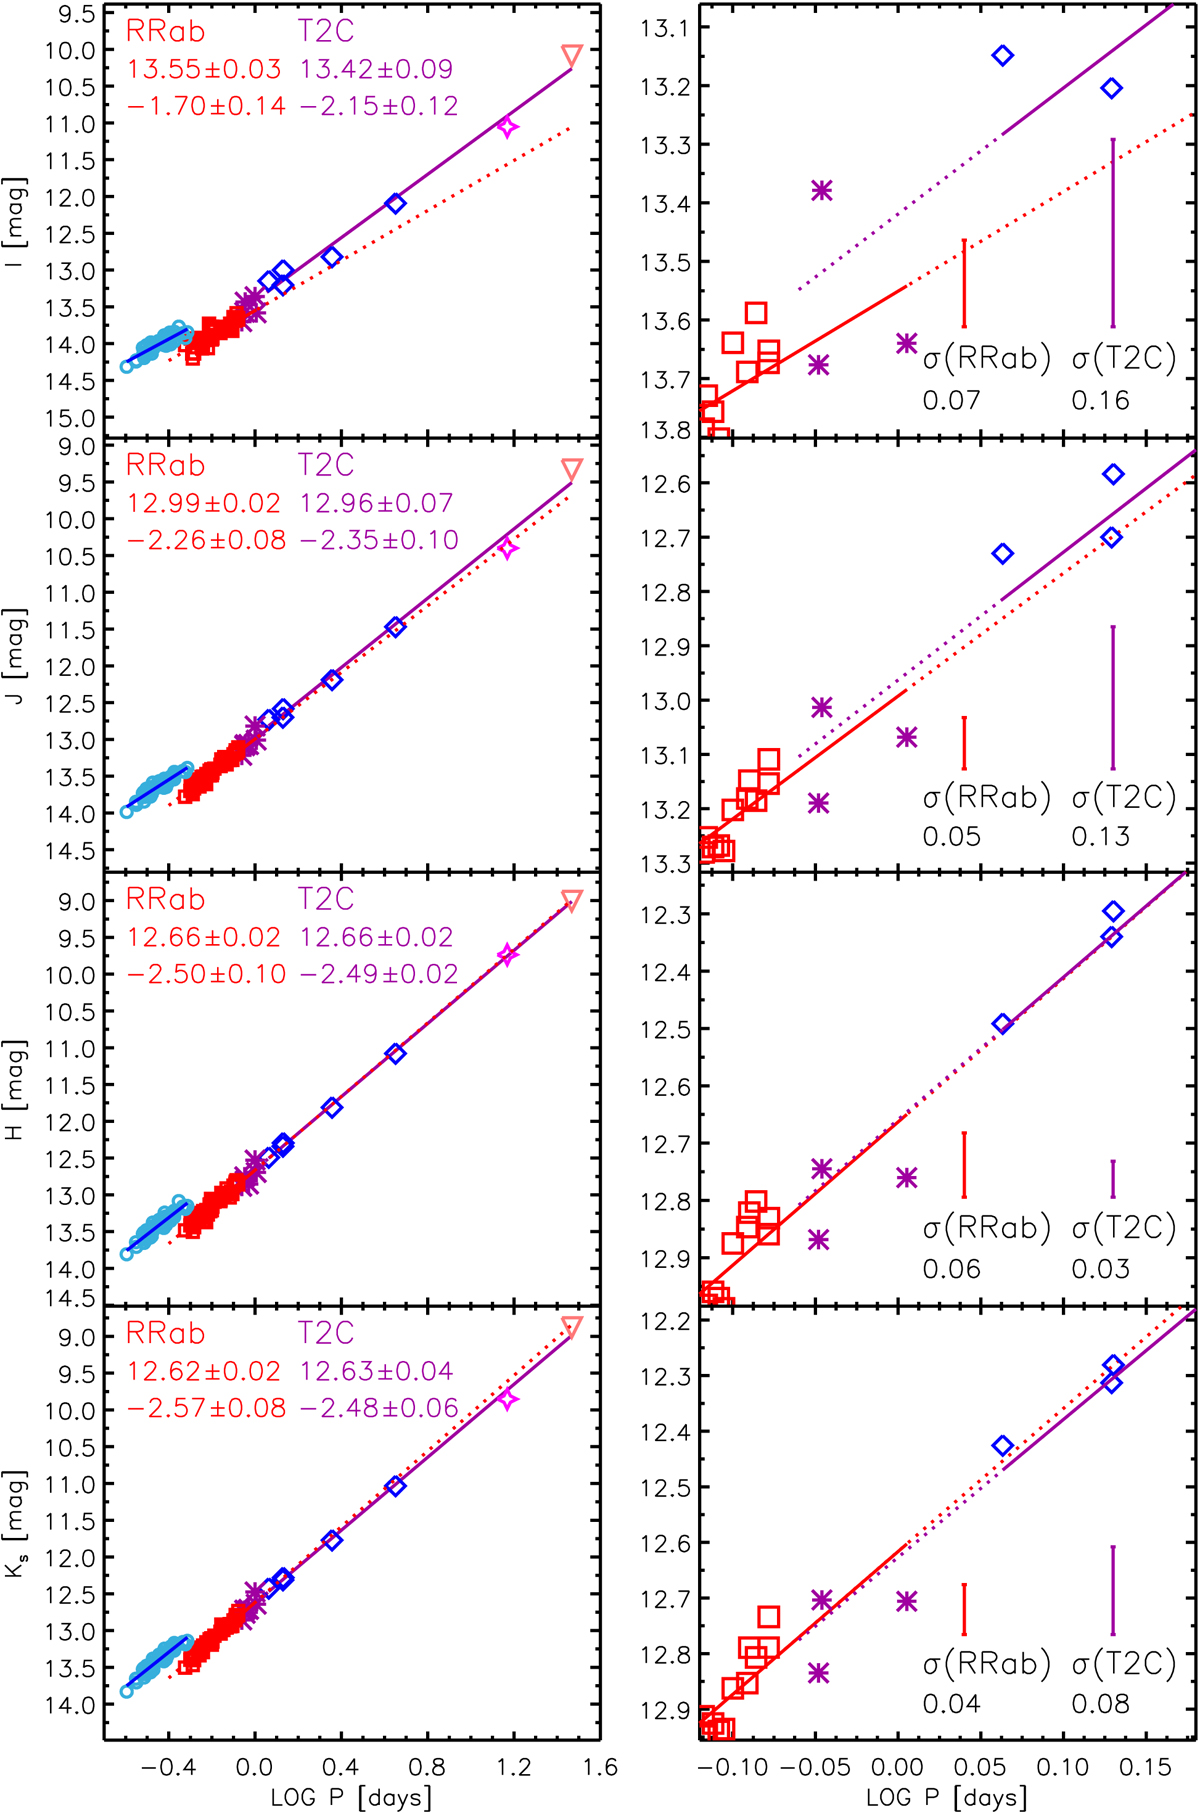
IJHKs PL relations of RRLs and T2Cs in ω Cen. The symbols have the same meaning as in Figs. 1 and 4. Left panels: RRLs and T2Cs, and right panels: close-up of the period range of the transition between long-period RRab and BLHs. Red and purple lines show the PL relation of RRab and T2Cs, respectively. The dotted lines show the extension at longer and shorter periods of the RRab and T2Cs PL relations, respectively. The dispersions of the relations are displayed as bars in the lower right corner of the right panels.
Current usage metrics show cumulative count of Article Views (full-text article views including HTML views, PDF and ePub downloads, according to the available data) and Abstracts Views on Vision4Press platform.
Data correspond to usage on the plateform after 2015. The current usage metrics is available 48-96 hours after online publication and is updated daily on week days.
Initial download of the metrics may take a while.