Fig. 7.
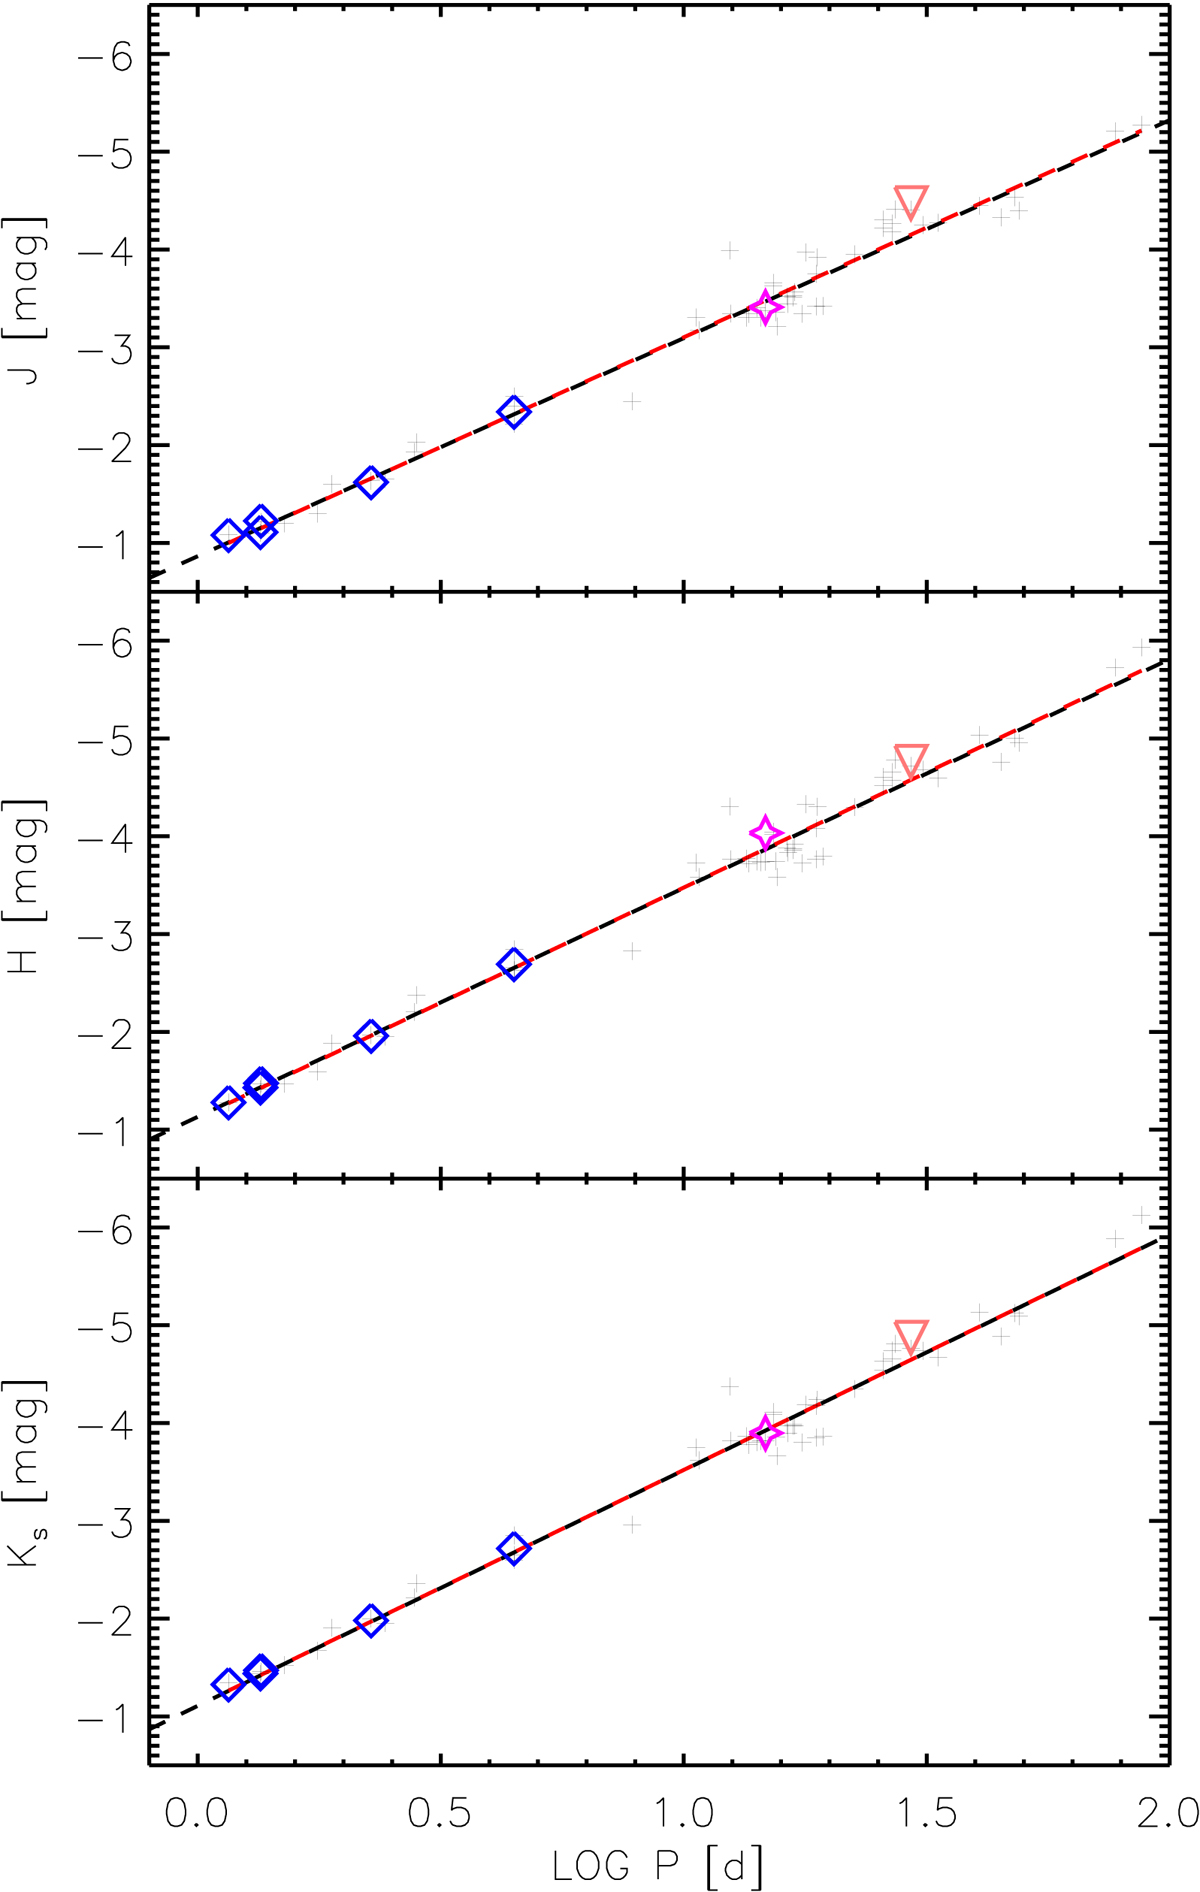
Top: J-band PL relation of T2Cs in GGCs. Symbols for ω Cen are the same as in Figs. 1 and 4, the T2Cs from other GGCs are displayed as black crosses. The dashed black line displays the PL found by Matsunaga et al. (2006), and the dashed red line displays our own PL. Middle: same as in the top panel, but for the H-band PL relation. Bottom: same as in the top panel, but for the Ks-band PL relation.
Current usage metrics show cumulative count of Article Views (full-text article views including HTML views, PDF and ePub downloads, according to the available data) and Abstracts Views on Vision4Press platform.
Data correspond to usage on the plateform after 2015. The current usage metrics is available 48-96 hours after online publication and is updated daily on week days.
Initial download of the metrics may take a while.