Fig. 6.
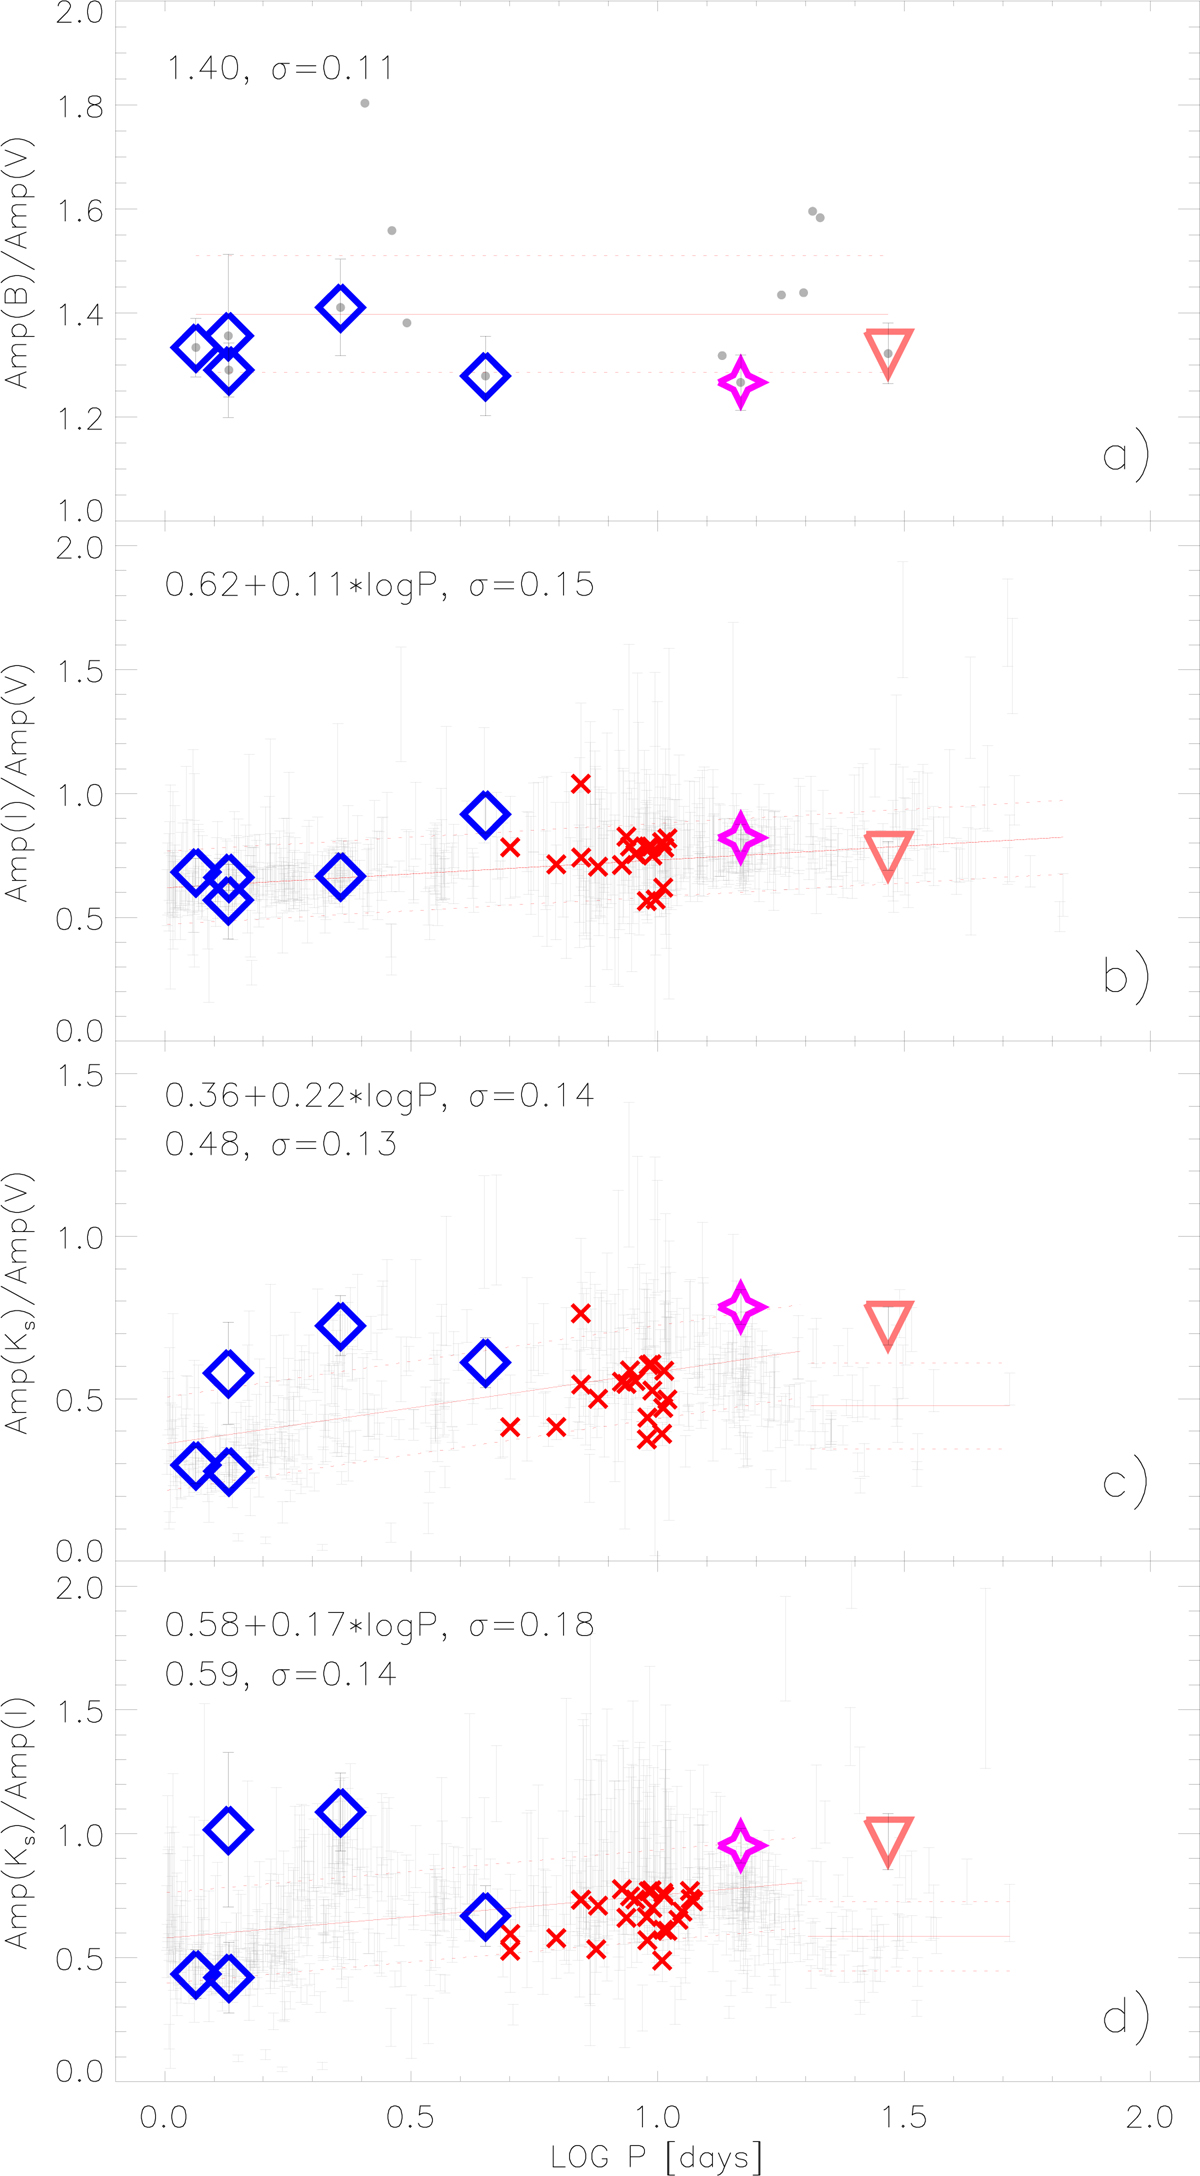
Panel a: B over V amplitude ratios of GGC T2Cs. Black shows T2Cs from NGC 6388 and NGC 6441, and the other symbols have the same meaning as in Figs. 1 and 4. The solid red line denotes the average, and the dotted lines denote the 1σ dispersion. Panel b: I over V amplitude ratios of bulge and ω Cen T2Cs. The red line displays a linear fit. The symbols have the same meaning as in Fig. 5. Panel c: same as in panel b, but for Ks over V amplitude ratios. The red line displays a linear fit for log P < 1.3 and the average for log P > 1.3. Panel d: same as in panel b, but for Ks over I amplitude ratios. The red line displays a linear fit for log P < 1.3 and the average for log P > 1.3.
Current usage metrics show cumulative count of Article Views (full-text article views including HTML views, PDF and ePub downloads, according to the available data) and Abstracts Views on Vision4Press platform.
Data correspond to usage on the plateform after 2015. The current usage metrics is available 48-96 hours after online publication and is updated daily on week days.
Initial download of the metrics may take a while.