Fig. 5.
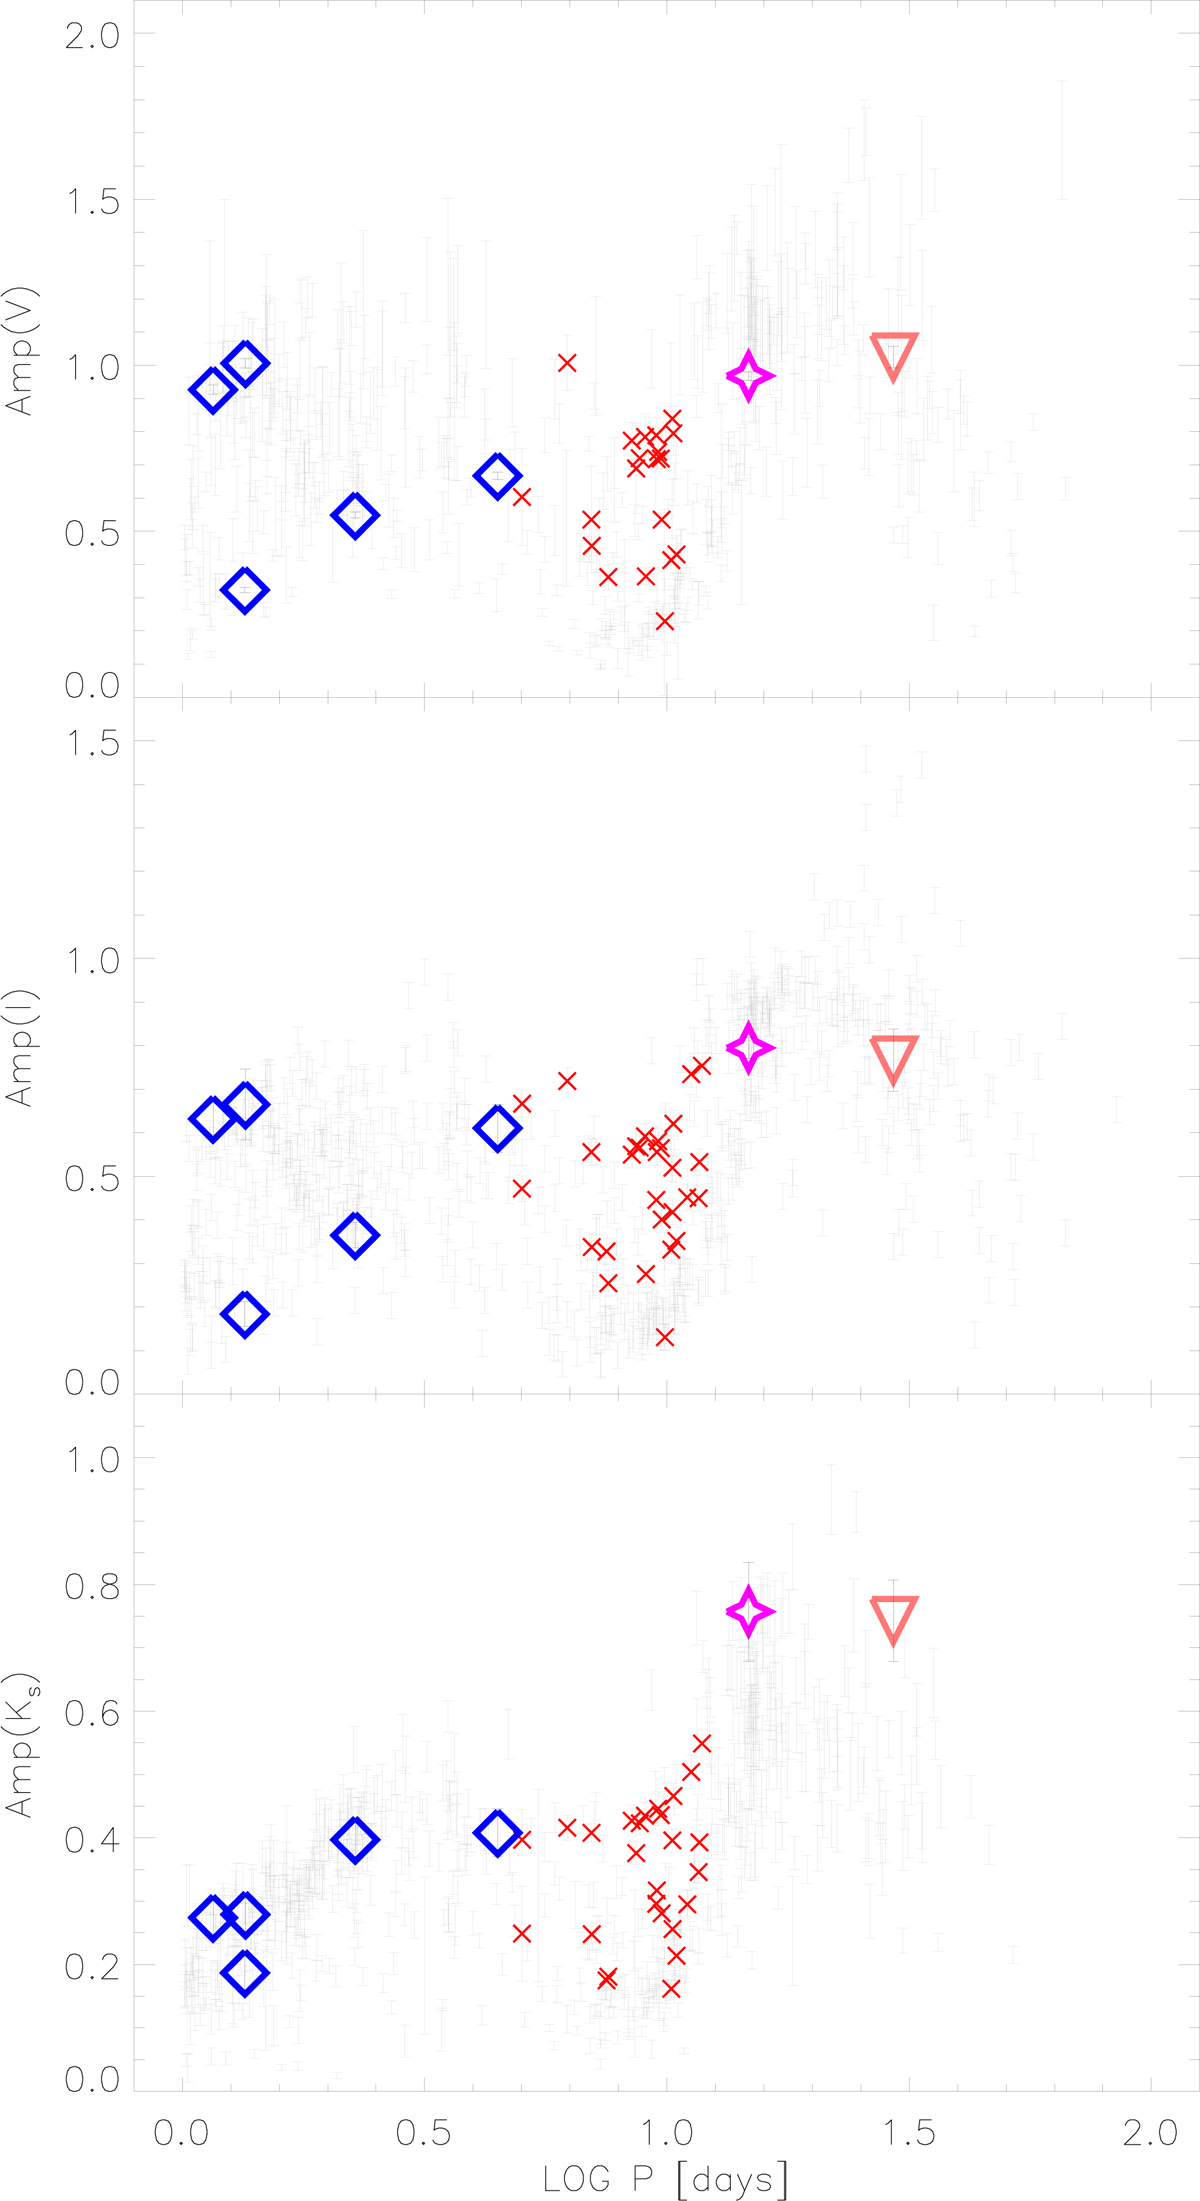
Top: Bailey diagram of bulge and ω Cen T2Cs in the V band. Gray shows bulge BLHs, red crosses present bulge pWVs, and the other symbols are for ω Cen T2Cs and have the same meaning as in Figs. 1 and 4. The uncertainties of the light-curve amplitudes of ω Cen T2Cs are displayed as black error bars. Middle: same as in the top panel, but for the I band. The OGLE catalogs do not provide the uncertainties on the Amp(I), therefore we assumed an uncertainty of 0.05 mag. This is a conservative assumption because the median of the uncertainties on Amp(V) is 0.052 mag, and the I-band time series of OGLE have about one order of magnitude more points than the V-band time series. Bottom: same as in the top panel, but for the Ks band.
Current usage metrics show cumulative count of Article Views (full-text article views including HTML views, PDF and ePub downloads, according to the available data) and Abstracts Views on Vision4Press platform.
Data correspond to usage on the plateform after 2015. The current usage metrics is available 48-96 hours after online publication and is updated daily on week days.
Initial download of the metrics may take a while.