Free Access
Fig. 3.
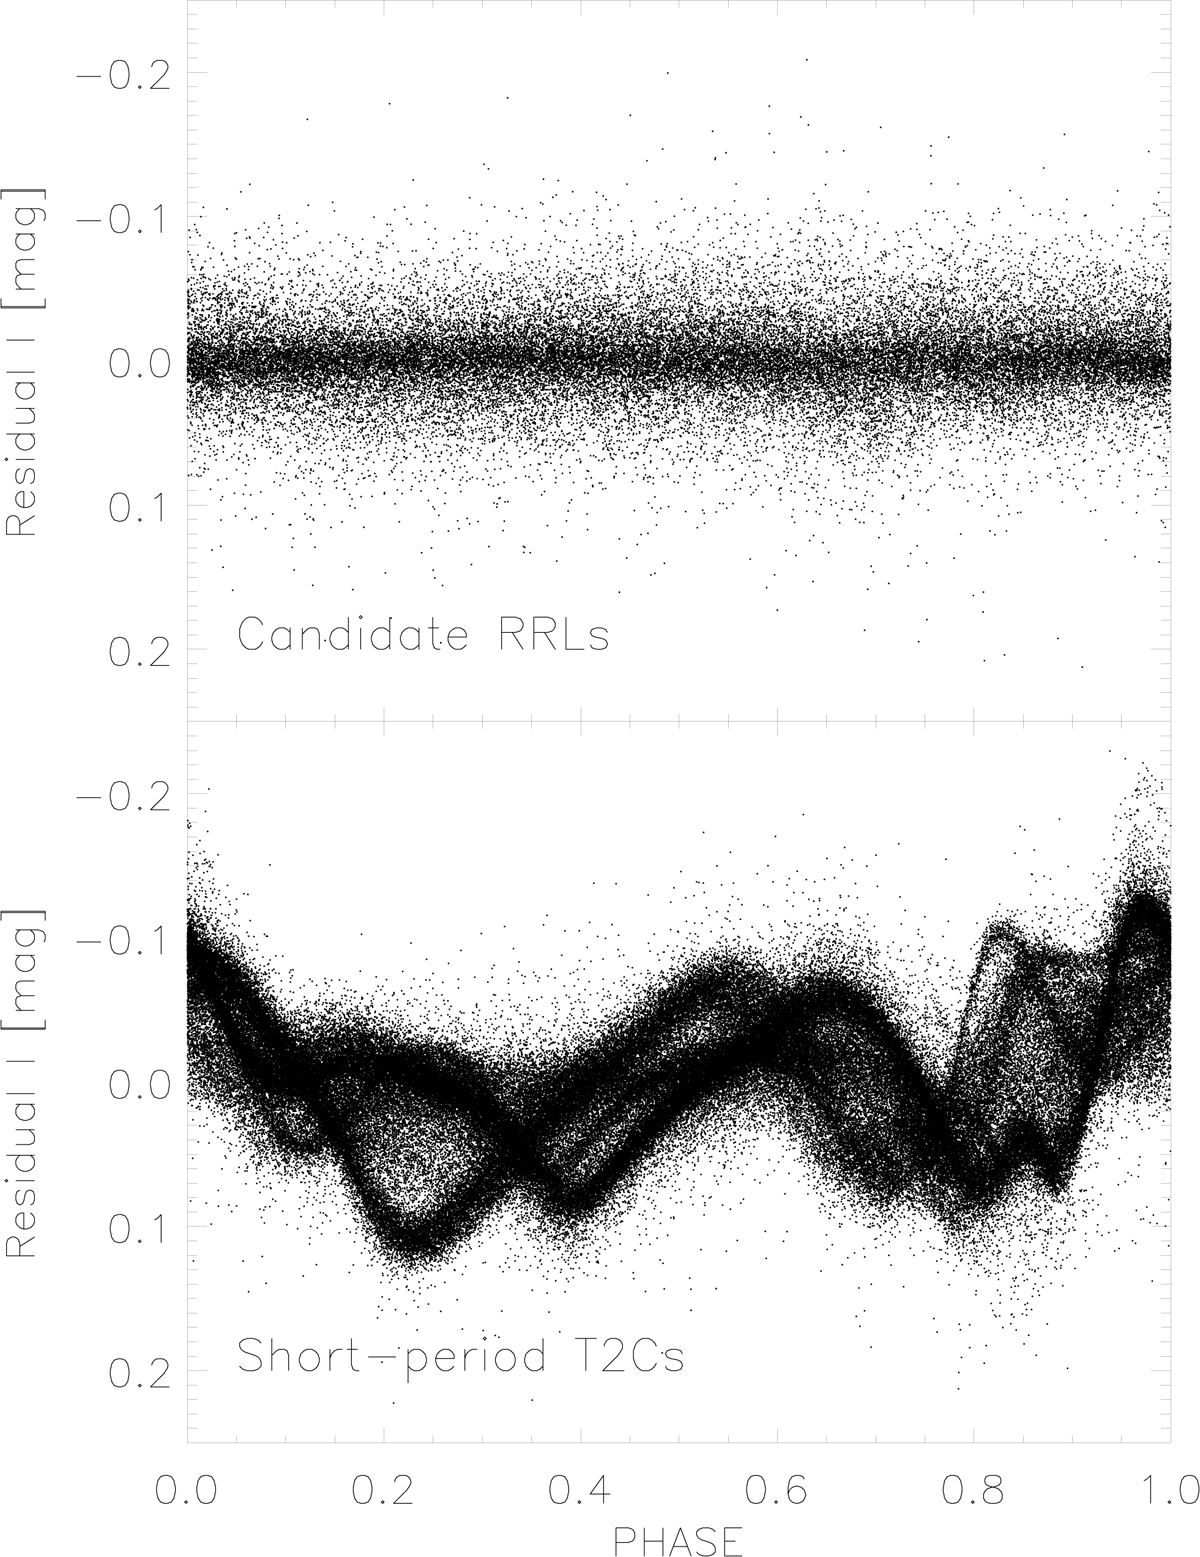
Top: residuals of the I-band light curve of all candidate RRLs from the template fit. All the variables were phased with the period and epoch of maximum provided by OGLE, meaning that phase 0 is the phase of maximum brightness. Bottom: same as in the top panel, but for all the short-period T2Cs.
Current usage metrics show cumulative count of Article Views (full-text article views including HTML views, PDF and ePub downloads, according to the available data) and Abstracts Views on Vision4Press platform.
Data correspond to usage on the plateform after 2015. The current usage metrics is available 48-96 hours after online publication and is updated daily on week days.
Initial download of the metrics may take a while.