Fig. 2.
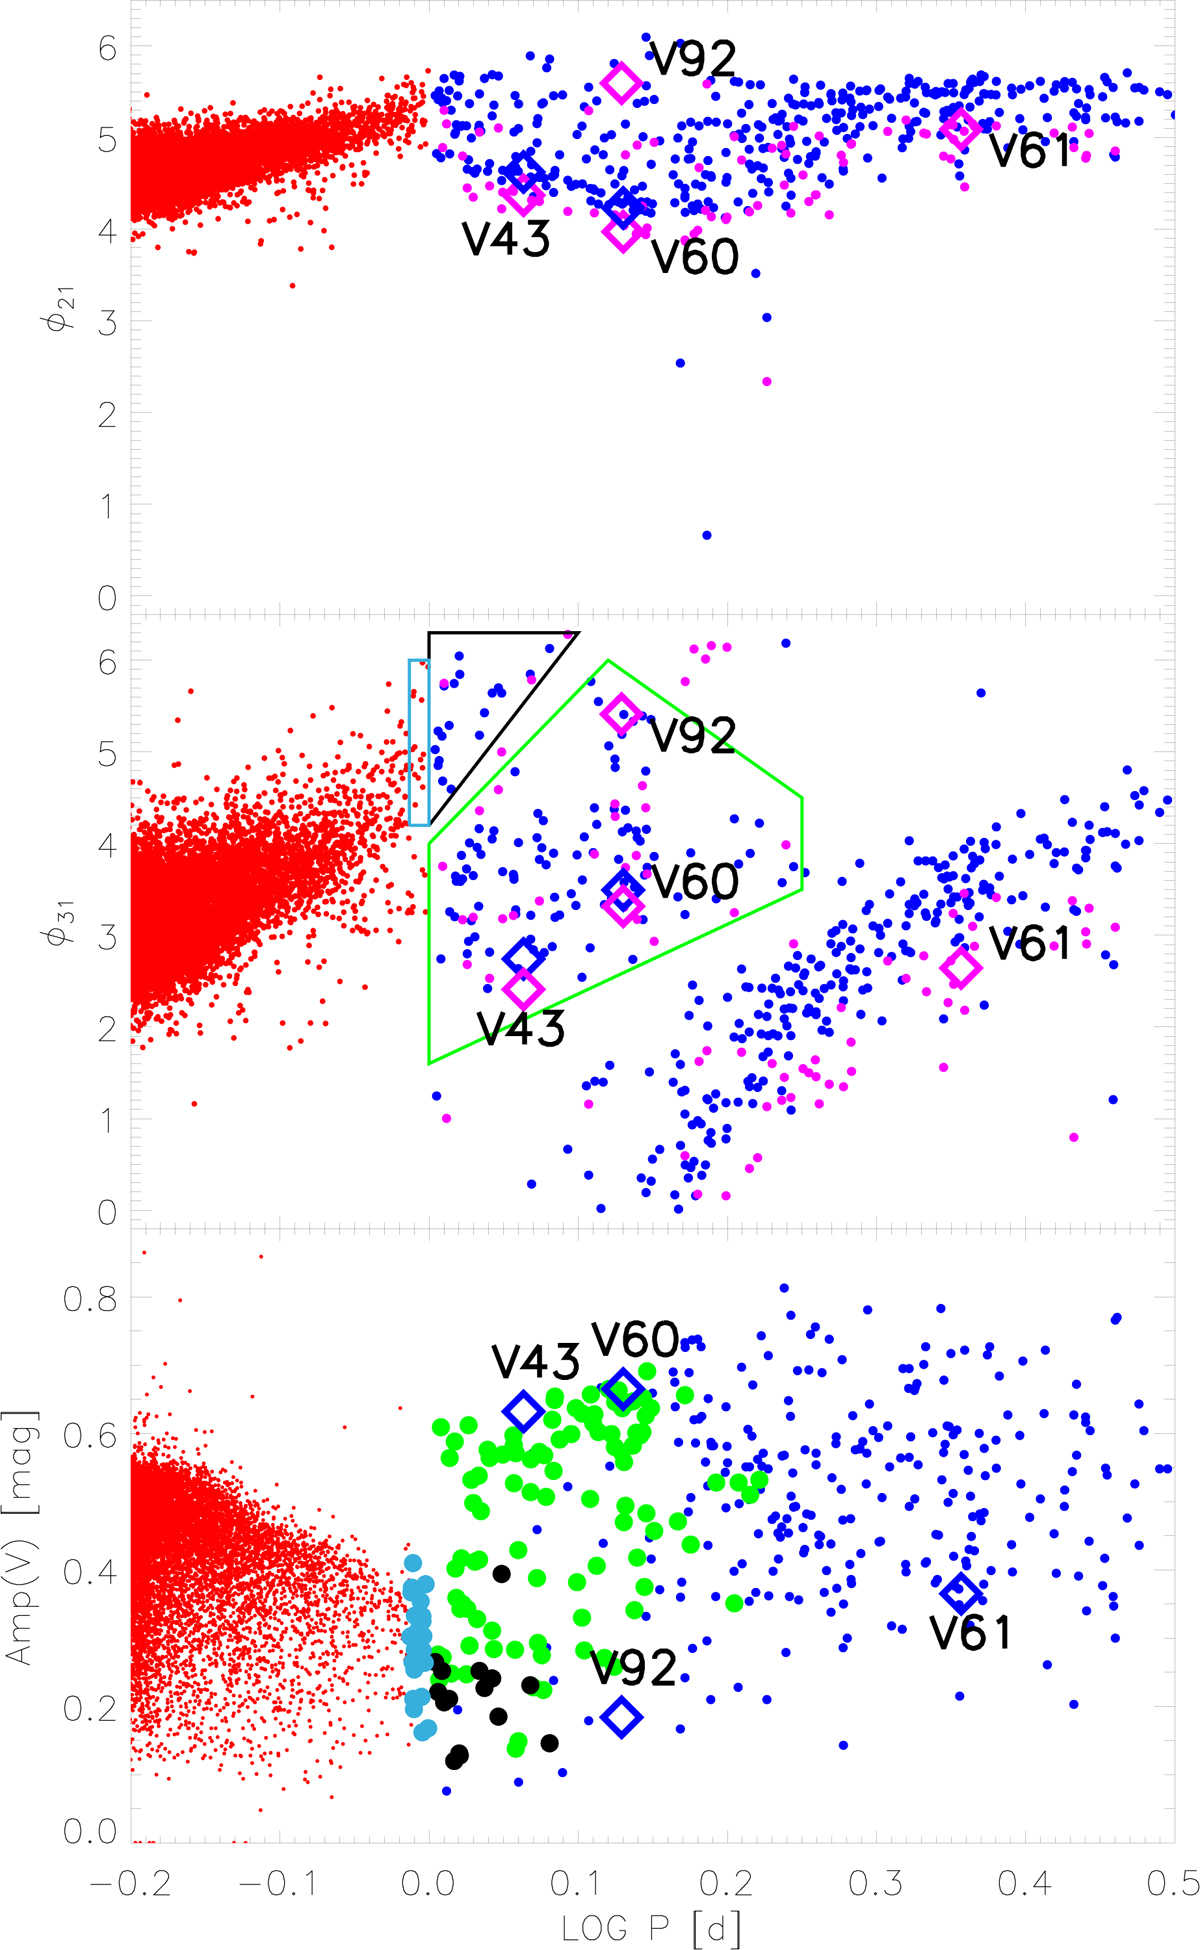
Top: ϕ21 − log P diagram of long-period RRLs and short-period T2Cs in ω Cen and Galactic bulge. Red dots present RRab, blue dots show T2Cs (I-band Fourier coefficients), and magenta dots present T2Cs (V-band Fourier coefficients). Middle: same as the top panel, but for the ϕ31 coefficients. The green box contains variables in the short-period T2C sample, the black box contains variables in the candidate RRL sample, and the light blue box contains variables in the RRL template sample. Bottom: bailey diagram of the same variables as in the top and middle panel. Light blue, black, and green cicles display variables in the short-period T2C, candidate RRL, and RRL template samples, respectively.
Current usage metrics show cumulative count of Article Views (full-text article views including HTML views, PDF and ePub downloads, according to the available data) and Abstracts Views on Vision4Press platform.
Data correspond to usage on the plateform after 2015. The current usage metrics is available 48-96 hours after online publication and is updated daily on week days.
Initial download of the metrics may take a while.