Fig. 6.
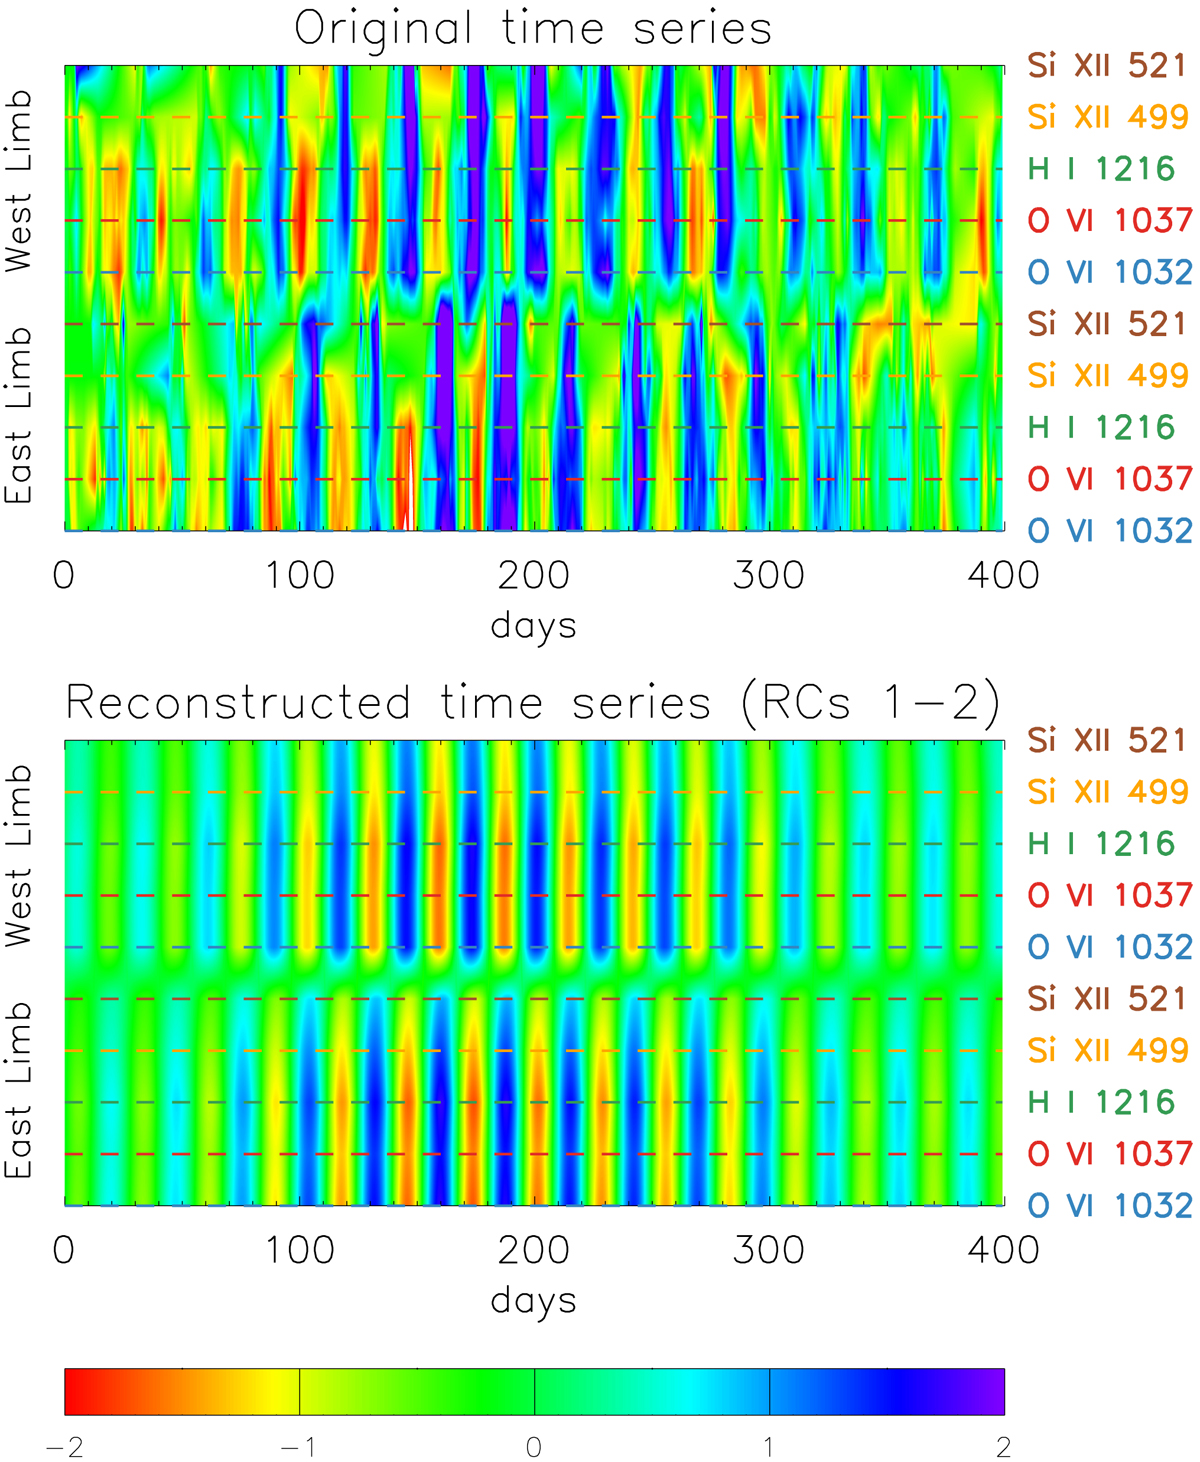
Top: contour plot showing original UV line intensities versus time (x-axis) and spectral line (y-axis) at a given colatitude (120°) for both east and west limbs. Bottom: same as above but showing the UV line intensities reconstructed from the first two leading components (RCs 1−2) obtained with the MSSA technique by using a lag window length M = 60.
Current usage metrics show cumulative count of Article Views (full-text article views including HTML views, PDF and ePub downloads, according to the available data) and Abstracts Views on Vision4Press platform.
Data correspond to usage on the plateform after 2015. The current usage metrics is available 48-96 hours after online publication and is updated daily on week days.
Initial download of the metrics may take a while.