Free Access
Fig. 3.
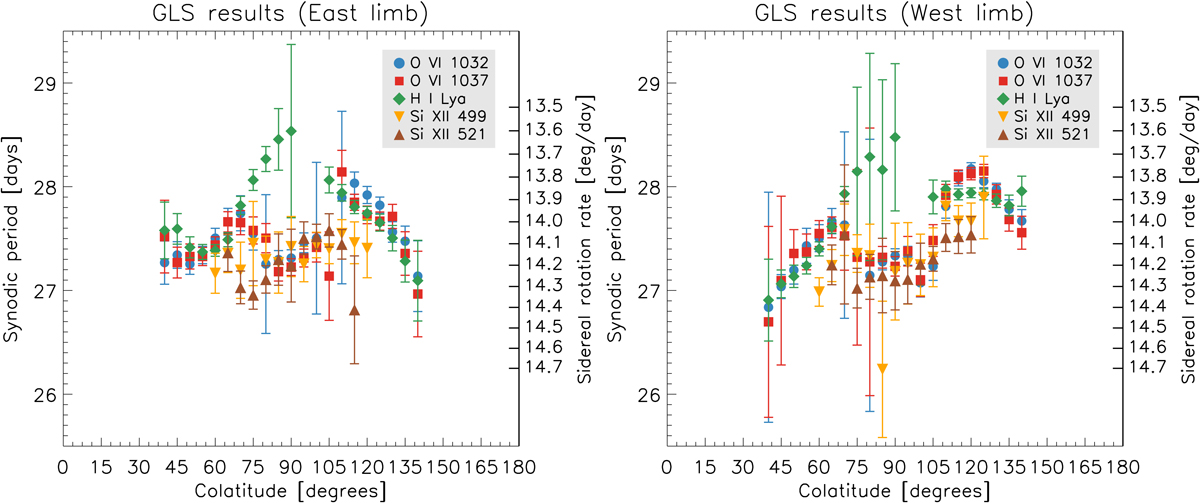
Colatitude dependence of UV corona rotation rate at 1.7 R⊙ obtained with the generalized Lomb-Scargle (GLS) periodogram technique at the east (left panel) and west limbs (right panel) from the analysis of the time series of five different UV spectral lines.
Current usage metrics show cumulative count of Article Views (full-text article views including HTML views, PDF and ePub downloads, according to the available data) and Abstracts Views on Vision4Press platform.
Data correspond to usage on the plateform after 2015. The current usage metrics is available 48-96 hours after online publication and is updated daily on week days.
Initial download of the metrics may take a while.