Free Access
Fig. 1.
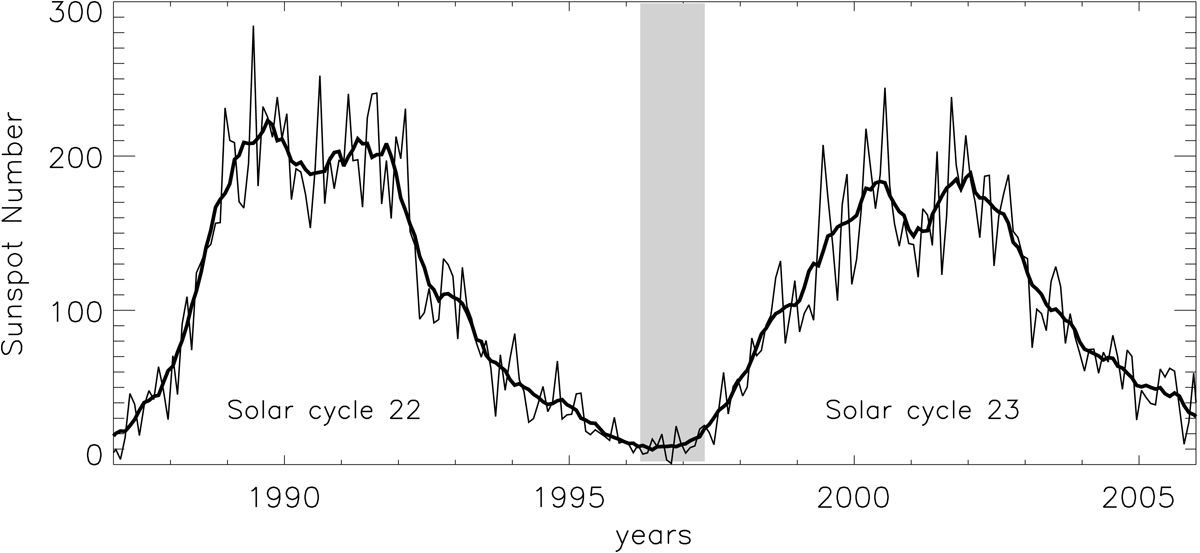
Monthly and smoothed sunspot numbers from 1987 to 2006. The shaded region shows the time interval that has been used for the study of the coronal rotation at solar minimum. Courtesy of Solar Influences Data Analysis Center (SIDC), Belgium.
Current usage metrics show cumulative count of Article Views (full-text article views including HTML views, PDF and ePub downloads, according to the available data) and Abstracts Views on Vision4Press platform.
Data correspond to usage on the plateform after 2015. The current usage metrics is available 48-96 hours after online publication and is updated daily on week days.
Initial download of the metrics may take a while.