Fig. 6.
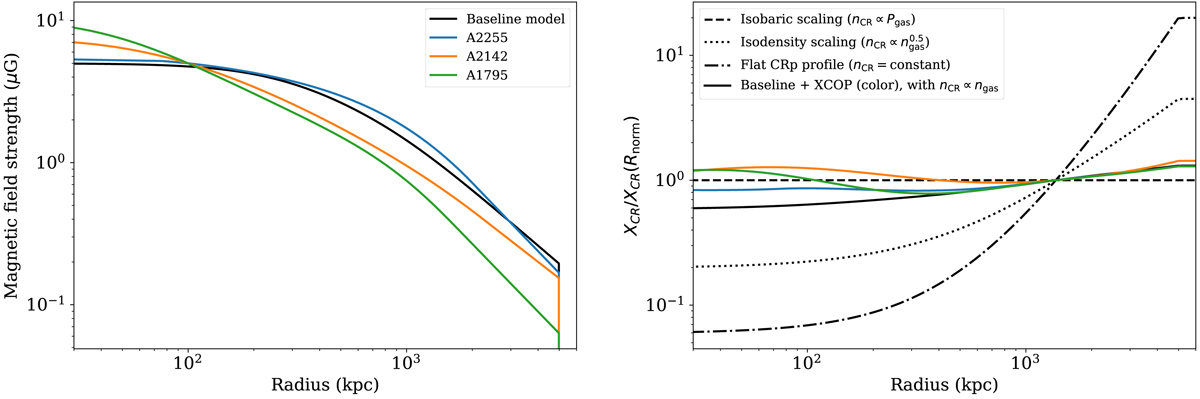
Magnetic field and CRp-to-thermal energy properties of the baseline cluster model. Left: magnetic field profile obtained by assuming a fixed magnetic field strength of 5 μG at 100 kpc, and a scaling relative to the thermal density as ![]() . Right: CRp-to-thermal energy profile for different models of the CRp distribution. The color lines show each real cluster, using the same colors as in the left panel, and with nCRp ∝ ngas. The black lines correspond to variation in the CRp scaling with respect to the thermal gas for the baseline cluster model, as indicated in the legend.
. Right: CRp-to-thermal energy profile for different models of the CRp distribution. The color lines show each real cluster, using the same colors as in the left panel, and with nCRp ∝ ngas. The black lines correspond to variation in the CRp scaling with respect to the thermal gas for the baseline cluster model, as indicated in the legend.
Current usage metrics show cumulative count of Article Views (full-text article views including HTML views, PDF and ePub downloads, according to the available data) and Abstracts Views on Vision4Press platform.
Data correspond to usage on the plateform after 2015. The current usage metrics is available 48-96 hours after online publication and is updated daily on week days.
Initial download of the metrics may take a while.