Fig. 17.
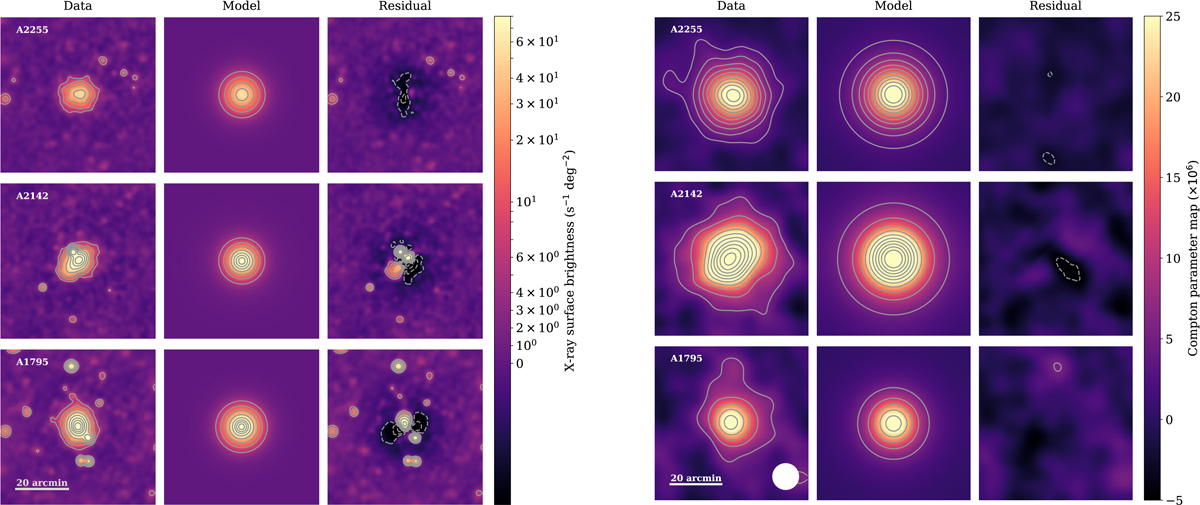
Comparison between the thermal gas observables and the MINOT model prediction. Left: comparison between ROSAT X-ray images and the MINOT model prediction. The scale is linear from −10 to 10 s−1 deg−2 and logarithmic above. Contours are as ±5 × 2N s−1 deg−2, with N the contour index starting at 0. Right: comparison between the Planck Compton parameter MILCA image and the MINOT model prediction. The contours are multiples of 3σ, where σ is the rms of the residual map. The Planck 10 arcmin FWHM beam is shown as a filled white circle. All maps where smoothed (in addition the intrinsic resolution) with a 2 arcmin FWHM gaussian beam for visual purpose. All the sky patches shown here are 1° × 1°.
Current usage metrics show cumulative count of Article Views (full-text article views including HTML views, PDF and ePub downloads, according to the available data) and Abstracts Views on Vision4Press platform.
Data correspond to usage on the plateform after 2015. The current usage metrics is available 48-96 hours after online publication and is updated daily on week days.
Initial download of the metrics may take a while.