Fig. 13.
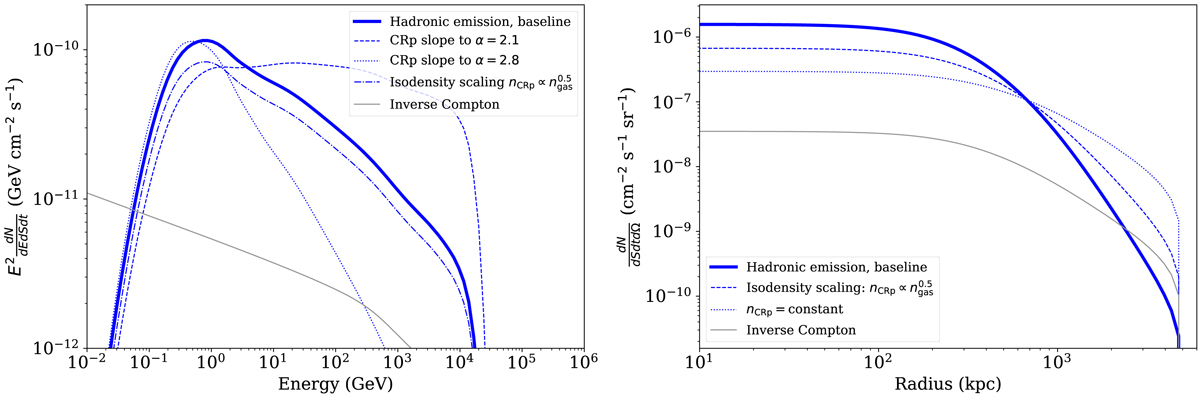
Observables associated with the γ-ray hadronic emission. The signal coming from inverse Compton interactions is also shown for comparison. Left: γ-ray spectrum within R500. Right: γ-ray profile integrated between 1 GeV and 1 TeV. The dynamical range of the profile amplitude has been set to the same value for all observables.
Current usage metrics show cumulative count of Article Views (full-text article views including HTML views, PDF and ePub downloads, according to the available data) and Abstracts Views on Vision4Press platform.
Data correspond to usage on the plateform after 2015. The current usage metrics is available 48-96 hours after online publication and is updated daily on week days.
Initial download of the metrics may take a while.