Fig. 4
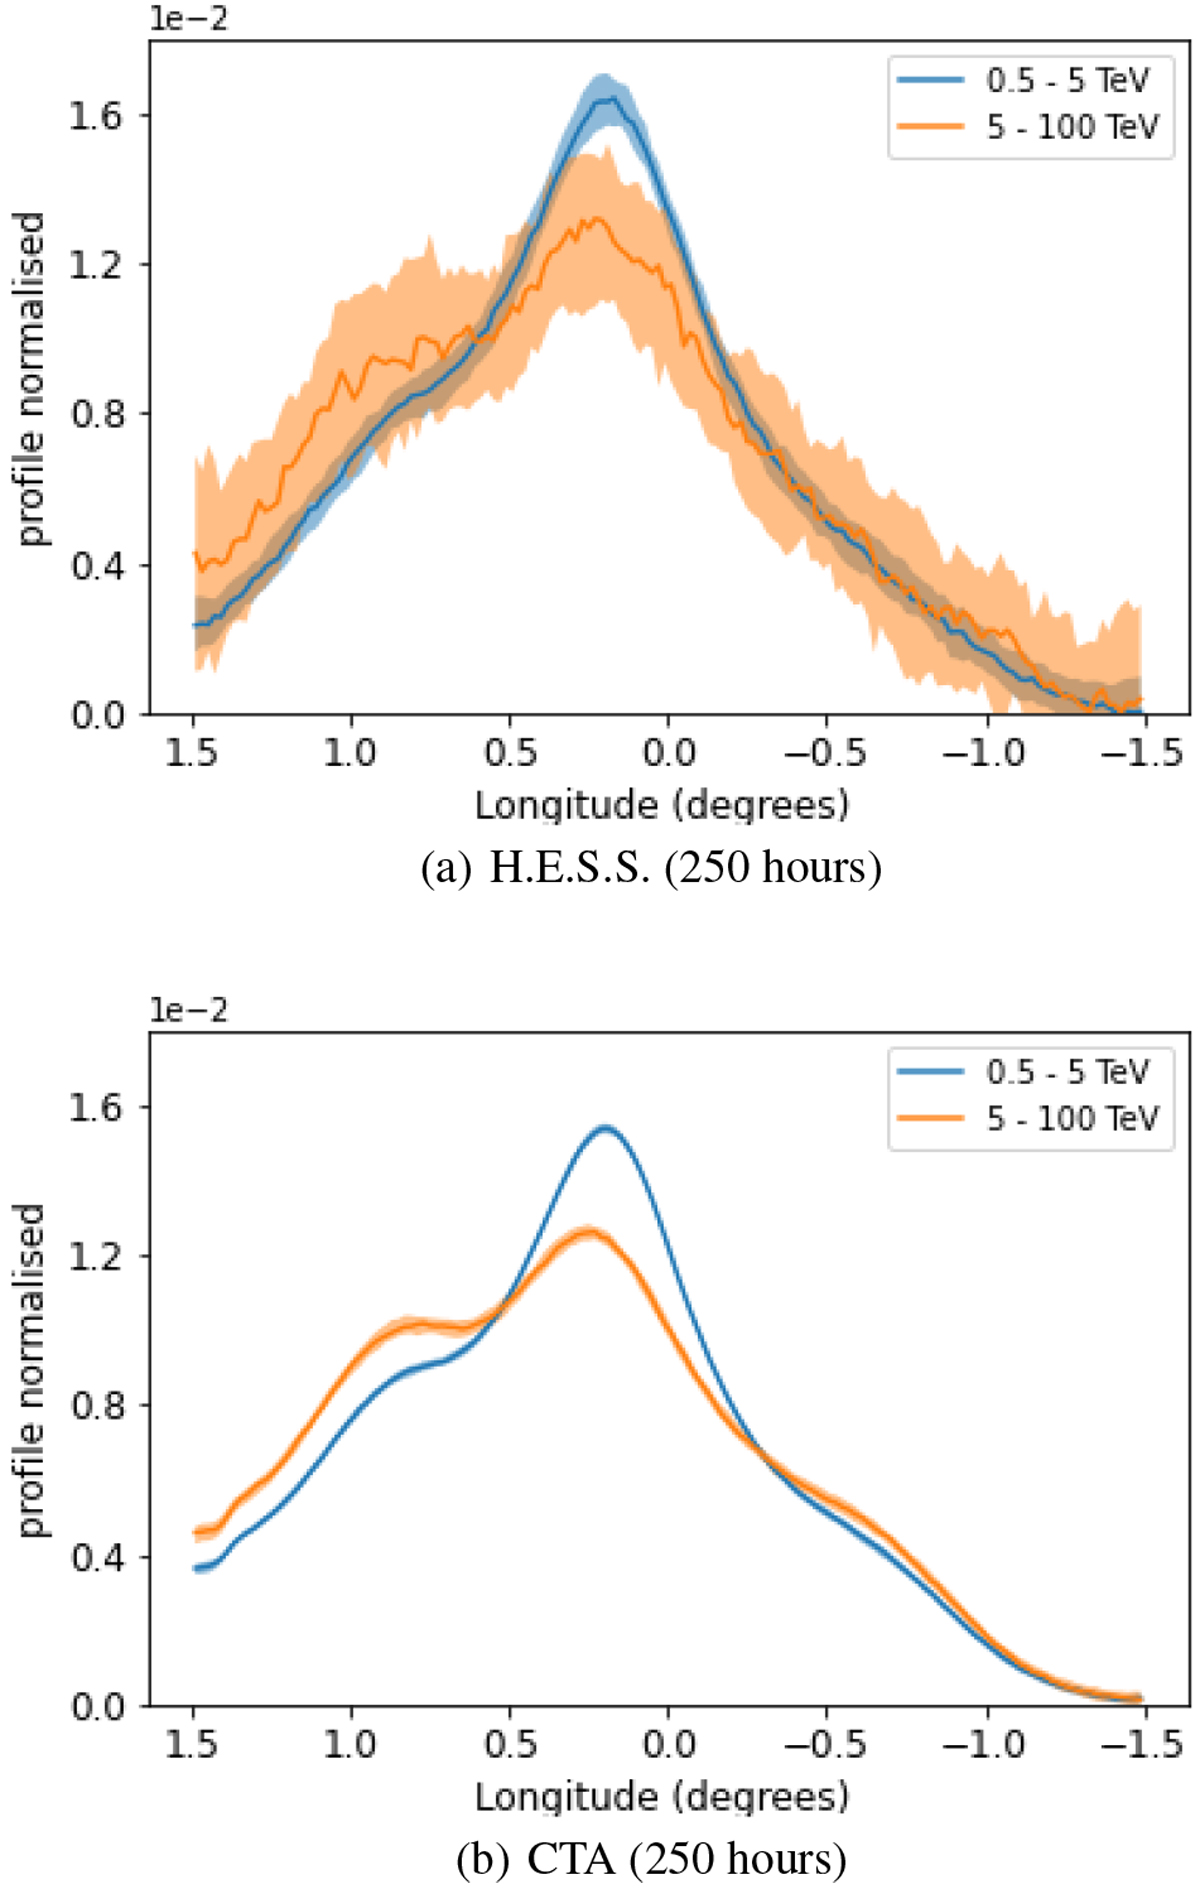
Expected γ-ray profile along the Galactic longitude from the simulation of 100 GC datasets of 250 h between 0.5–5 TeV (blue) and 5–100 TeV (orange). On the top those profiles are simulated using H.E.S.S. IRFs and on the bottom using CTA IRFs (version prod3b-v2, http://www.cta-observatory.org/science/cta-performance/). The solid lines represent the median of the 100 simulated datasets and the colored region the dispersion around the median. The dispersion contains 50% of the realizations in each longitude bin independently.
Current usage metrics show cumulative count of Article Views (full-text article views including HTML views, PDF and ePub downloads, according to the available data) and Abstracts Views on Vision4Press platform.
Data correspond to usage on the plateform after 2015. The current usage metrics is available 48-96 hours after online publication and is updated daily on week days.
Initial download of the metrics may take a while.