Fig. C.1
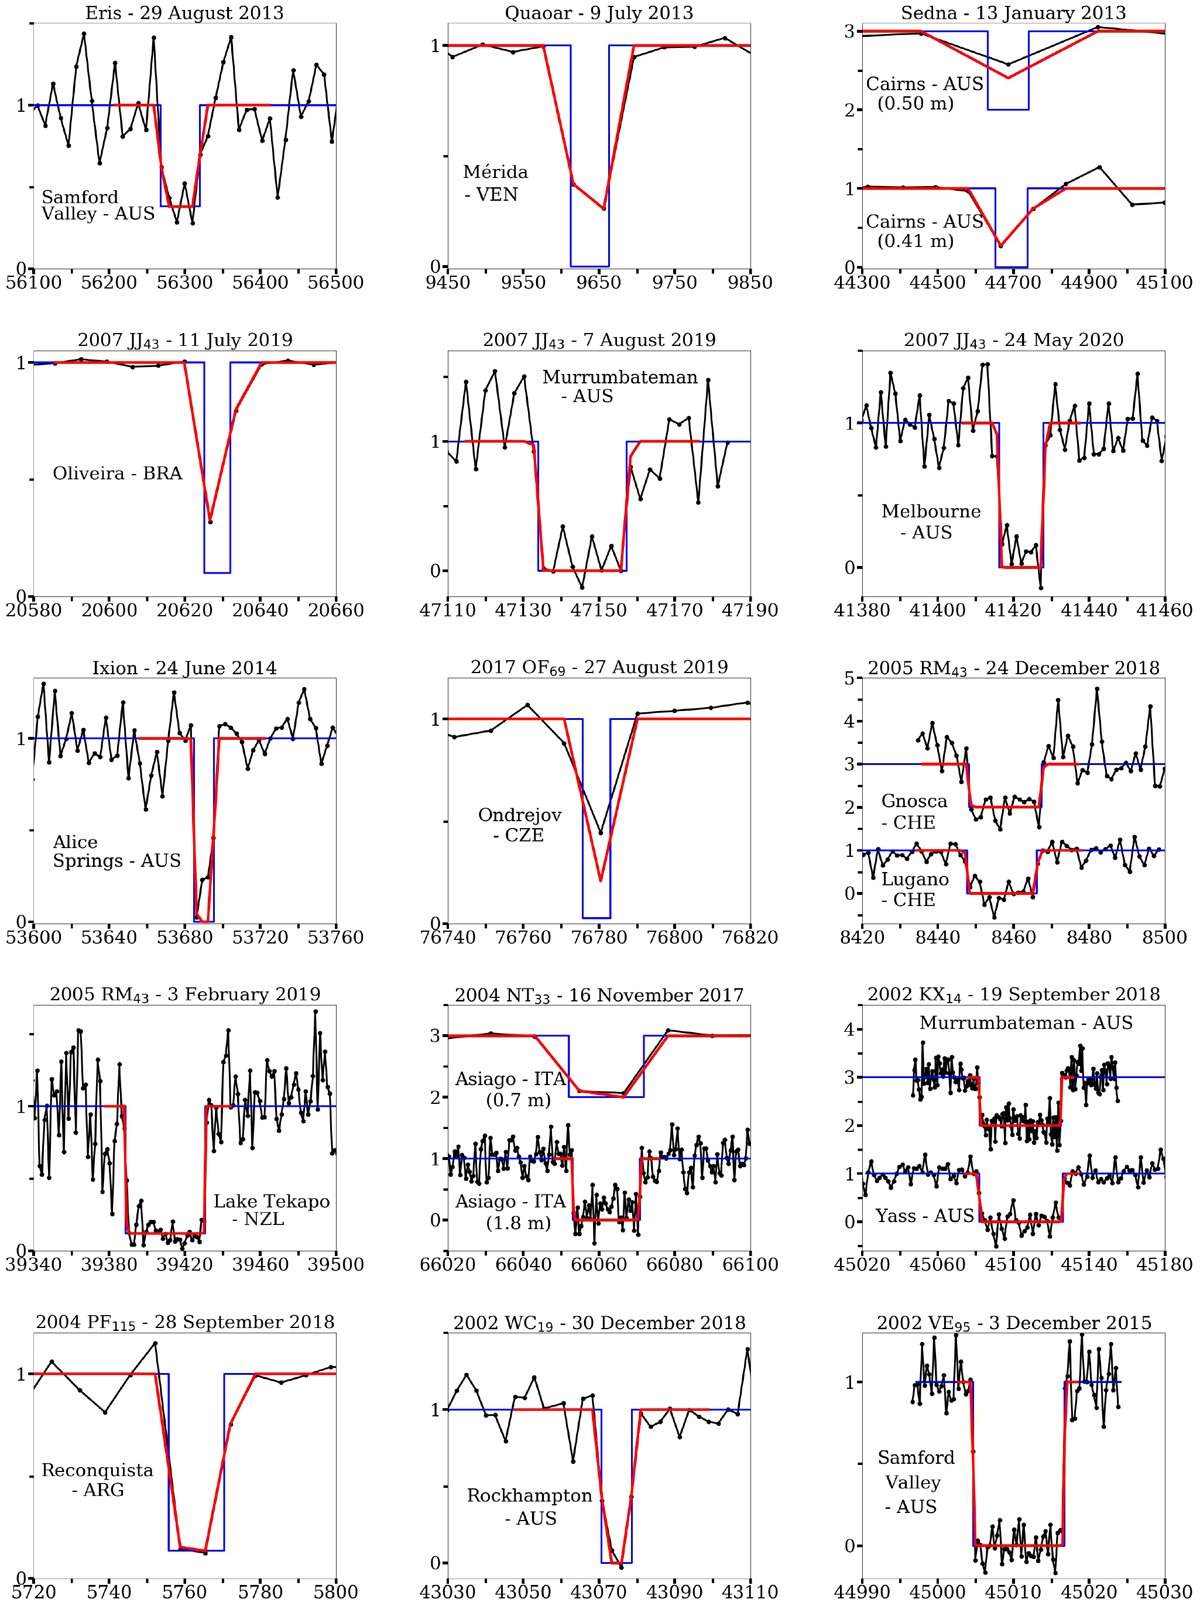
All occultation light curves of the unpublished stellar occultations. They are ordered by decreasing diameter of the occulting object, as in Table 1. The graphs present on the x-axis the time in seconds after midnight of the occultation date. On the y-axis, they show the relative flux, normalized to unity, of the occulted star divided by the reference stars. Some light curves were offset on the y-axis by an integer value for visualization purposes. Black lines represent the data, blue lines the model of a body without atmosphere occulting a punctual star at the derived times, and the red lines show the complete model where the Fresnel diffraction and the stellar diameter are convoluted to each finite exposure time.
Current usage metrics show cumulative count of Article Views (full-text article views including HTML views, PDF and ePub downloads, according to the available data) and Abstracts Views on Vision4Press platform.
Data correspond to usage on the plateform after 2015. The current usage metrics is available 48-96 hours after online publication and is updated daily on week days.
Initial download of the metrics may take a while.