Fig. 8
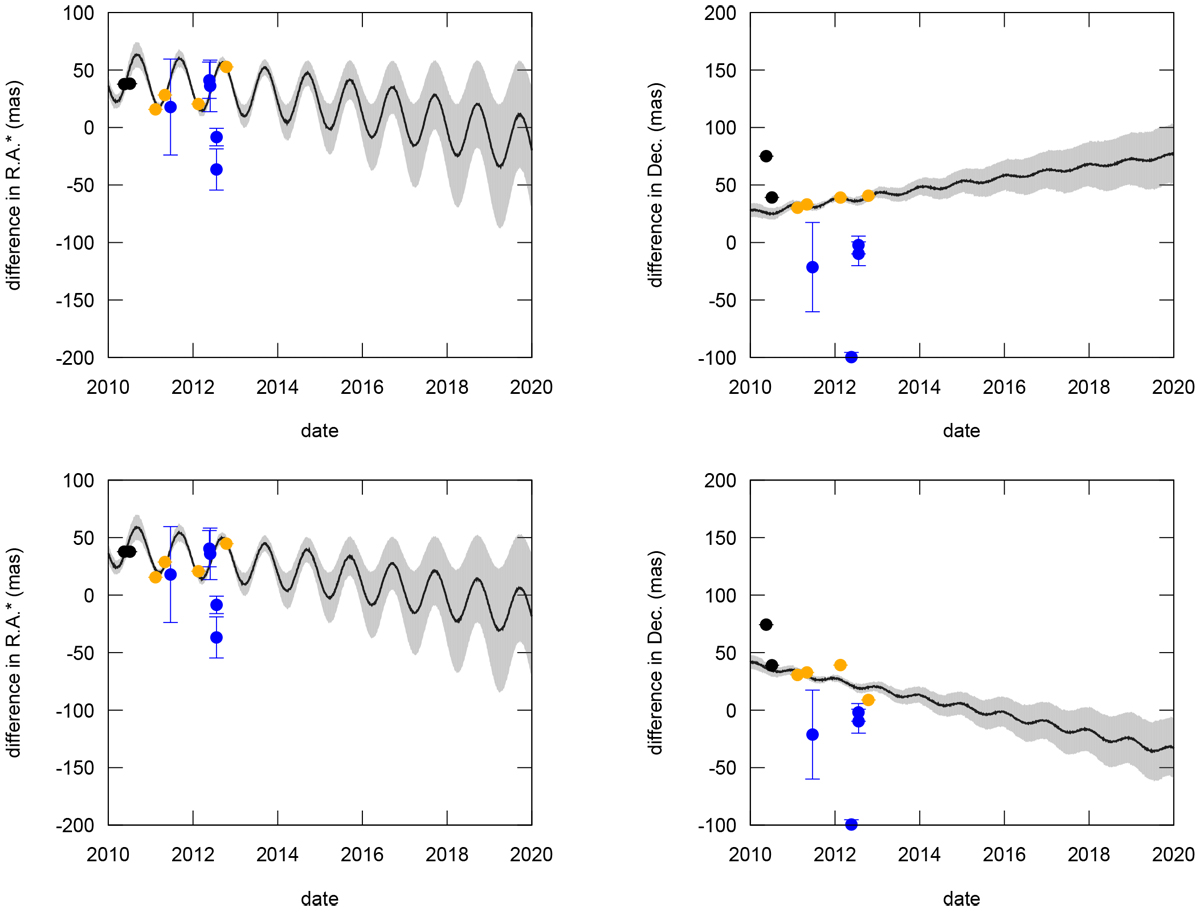
Ephemeris plots for Quaoar. The black lines again show the difference between NIMA and JPL. Gray regions are NIMA ephemeris uncertainties, and the yellow dots are astrometric positions from stellar occultation events. The black and blue dots are the object positions from classical astrometry. In the upper panels, we show the northern astrometric solution from Table 3. In the lower panels, we used the southern solution. The northern portions (upper panels) fit the ephemeris better, including the other yellow dots, allowing us for choosing this one as our preferred position.
Current usage metrics show cumulative count of Article Views (full-text article views including HTML views, PDF and ePub downloads, according to the available data) and Abstracts Views on Vision4Press platform.
Data correspond to usage on the plateform after 2015. The current usage metrics is available 48-96 hours after online publication and is updated daily on week days.
Initial download of the metrics may take a while.