Fig. 2.
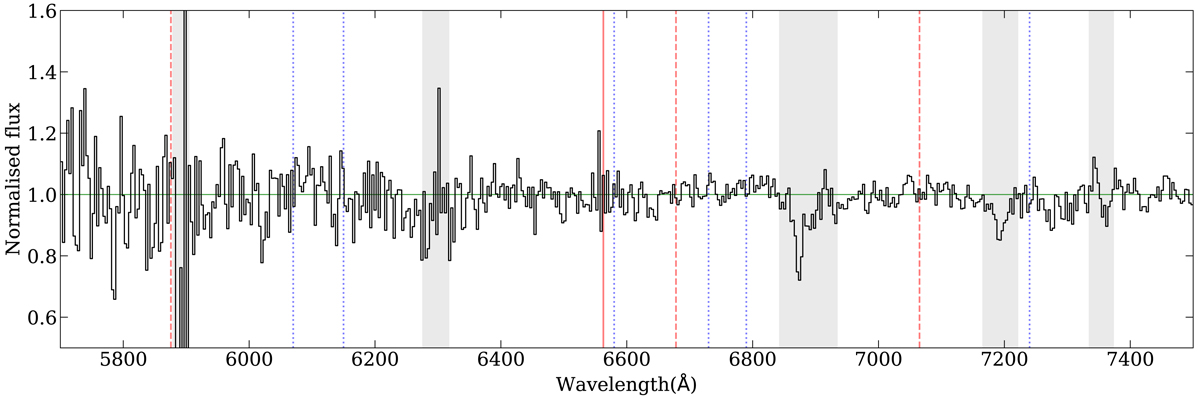
Normalised spectrum of 4U 1812−12 after subtraction of the nebular contribution (i.e. using the B-labelled regions from Fig. 1 for background correction). The red vertical lines indicate the position of Hα (solid) and several He emission lines (dashed). The vertical dotted blue lines indicate the approximate location of C and O blends detected in some ultra-compact systems (Nelemans et al. 2004). The grey-shaded bands indicate the spectral regions affected by interstellar or telluric features.
Current usage metrics show cumulative count of Article Views (full-text article views including HTML views, PDF and ePub downloads, according to the available data) and Abstracts Views on Vision4Press platform.
Data correspond to usage on the plateform after 2015. The current usage metrics is available 48-96 hours after online publication and is updated daily on week days.
Initial download of the metrics may take a while.