Fig. 7.
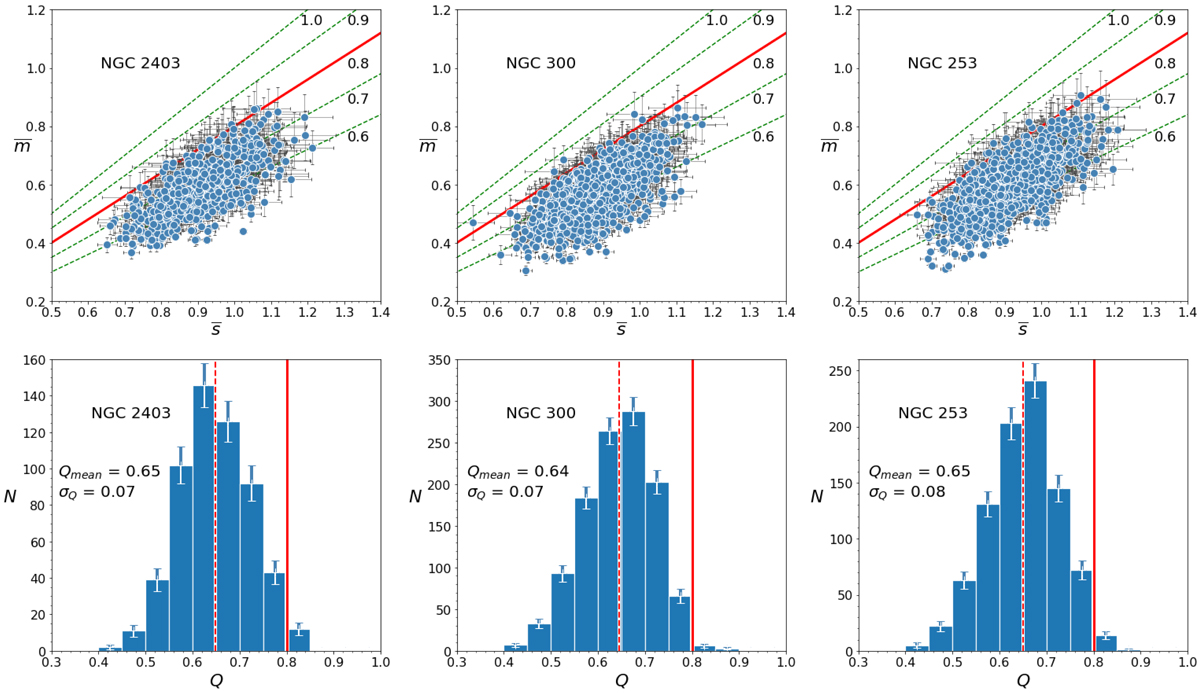
Top panels: show ![]() vs.
vs. ![]() for the YSGs located in each galaxy. The red continuous line indicates Q = 0.8, the dashed green lines indicate other Q values. The bottom panels: show the Q distributions for the three galaxies. We indicate the mean Q value and its standard deviation. The mean value is also indicated with a red dashed line, the red continuous line corresponds to Q = 0.8. The error bars were computed as
for the YSGs located in each galaxy. The red continuous line indicates Q = 0.8, the dashed green lines indicate other Q values. The bottom panels: show the Q distributions for the three galaxies. We indicate the mean Q value and its standard deviation. The mean value is also indicated with a red dashed line, the red continuous line corresponds to Q = 0.8. The error bars were computed as ![]() .
.
Current usage metrics show cumulative count of Article Views (full-text article views including HTML views, PDF and ePub downloads, according to the available data) and Abstracts Views on Vision4Press platform.
Data correspond to usage on the plateform after 2015. The current usage metrics is available 48-96 hours after online publication and is updated daily on week days.
Initial download of the metrics may take a while.