Fig. 6.
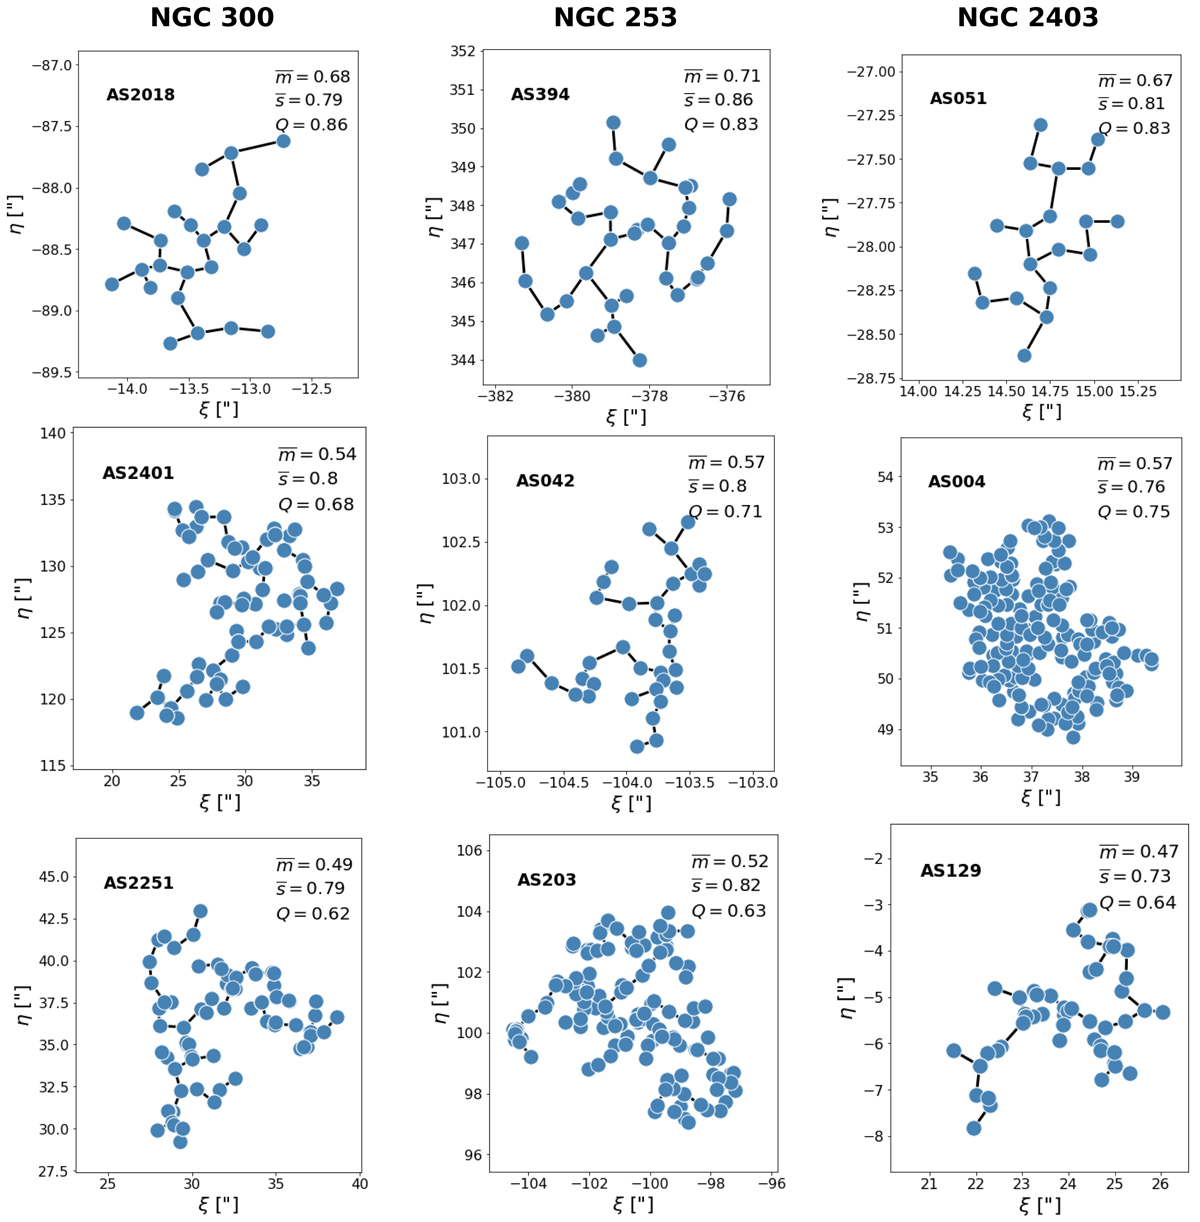
MST for three YSGs in each galaxy. The positions of the stars are indicated with blue circles and black lines represent the corresponding MST. The first column corresponds to YSGs in NGC 300, the second one to NGC 253, and the last column to NGC 2403. In each case, we show MST with different values of Q. The ![]() ,
, ![]() and Q values are also indicated in the upper-right corner of each panel.
and Q values are also indicated in the upper-right corner of each panel.
Current usage metrics show cumulative count of Article Views (full-text article views including HTML views, PDF and ePub downloads, according to the available data) and Abstracts Views on Vision4Press platform.
Data correspond to usage on the plateform after 2015. The current usage metrics is available 48-96 hours after online publication and is updated daily on week days.
Initial download of the metrics may take a while.